Fig. 13
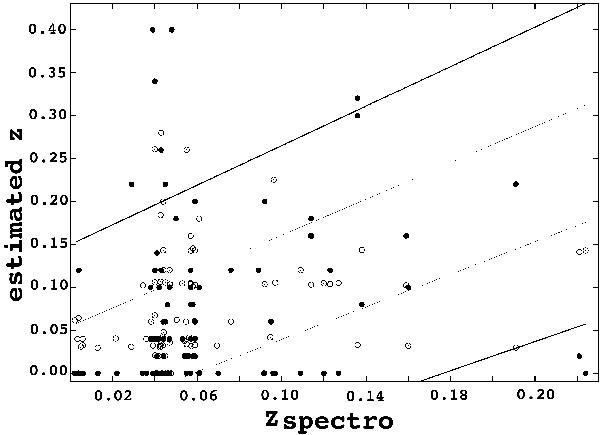
Photometric versus spectroscopic redshifts for a sample of 95 galaxies. Open circles correspond to redshifts estimated using Le PHARE (zLePhare). Black circles represent galaxies with zCIGALE redshifts. The region of catastrophic errors η, defined as | zspectro − zLePhare | /(1 + zspectro) > 0.15 (Ilbert et al. 2006), is marked by a solid black line. Dashed-dotted lines correspond to the zphoto = zspectro ± 0.055 (1 + zspectro). Eight galaxies without successfully measured photometric redshift (zLePhare) are not included in this plot.
Current usage metrics show cumulative count of Article Views (full-text article views including HTML views, PDF and ePub downloads, according to the available data) and Abstracts Views on Vision4Press platform.
Data correspond to usage on the plateform after 2015. The current usage metrics is available 48-96 hours after online publication and is updated daily on week days.
Initial download of the metrics may take a while.