Fig. 11
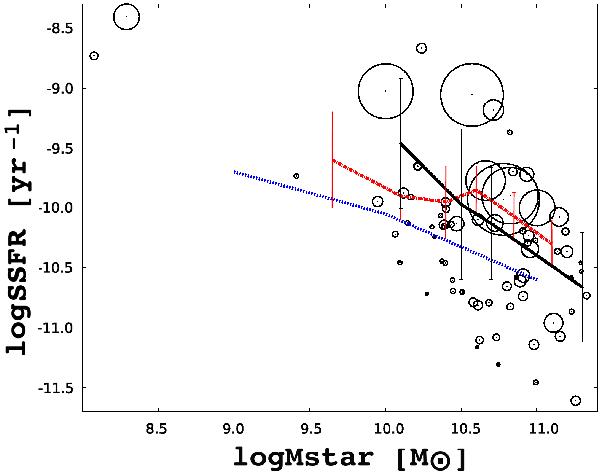
Relation between the specific star formation rate (SSFR) and stellar mass (the so-called star formation main sequence). The solid black line represents the volume-weighted average values of SSFR as a function of Mstar for our sample of 73 galaxies. Error bars correspond to the volume-weighted standard deviation. The stellar mass intervals are log Mstar ∈ [9.9 − 10.3] , [10.3 − 10.7] , [10.7 − 11.1] ,and [11.1 − 11.5]. The radius of the circle is related to the flux detected at the WIDE-S 90 μm band. The distribution of fluxes shows that the lower boundary of the stellar mass versus SSFR relation corresponds to the AKARI detection limit. The average SSFR versus log Mstar found by Brinchmann et al. (2004) is plotted as a dashed line. The average SSFR for the FIR-selected sample obtained by Buat et al. (2007) and 1σ errors are plotted as a dashed-dotted line.
Current usage metrics show cumulative count of Article Views (full-text article views including HTML views, PDF and ePub downloads, according to the available data) and Abstracts Views on Vision4Press platform.
Data correspond to usage on the plateform after 2015. The current usage metrics is available 48-96 hours after online publication and is updated daily on week days.
Initial download of the metrics may take a while.