Free Access
Fig. 10
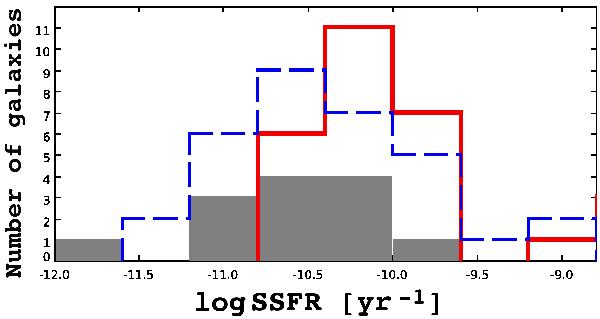
Distribution of the specific star formation rate (SSFR). The open red histogram (solid line) corresponds to galaxies with log Mstar < 10.5, the open blue histogram (dashed line) to galaxies with log Mstar in the range from 10.5 to 11, and filled gray histogram to galaxies with 11 < log Mstar < 11.5.
Current usage metrics show cumulative count of Article Views (full-text article views including HTML views, PDF and ePub downloads, according to the available data) and Abstracts Views on Vision4Press platform.
Data correspond to usage on the plateform after 2015. The current usage metrics is available 48-96 hours after online publication and is updated daily on week days.
Initial download of the metrics may take a while.