Free Access
Fig. A.21
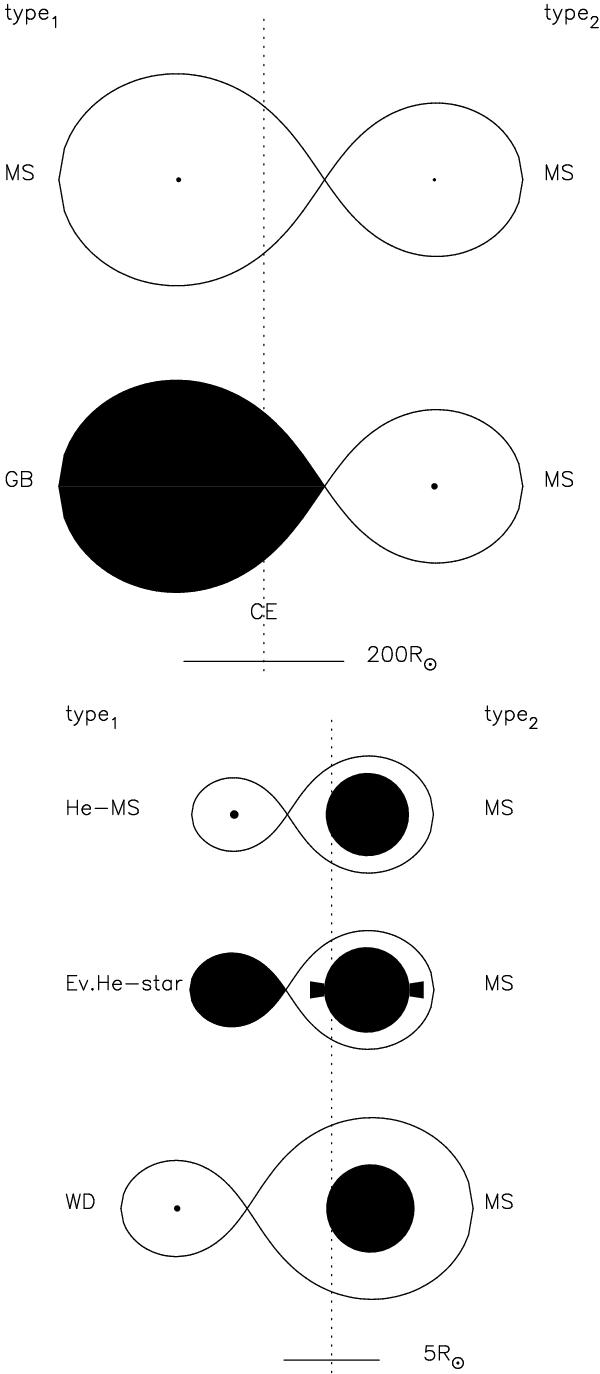
Example of the evolution of a SWD system in channel 4b. The primary fills its Roche lobe a second time. The top and bottom parts of the figure have different scales due to a CE-phase, denoted as CE in the figure. Abbreviations are as in Table A.2.
This figure is made of several images, please see below:
Current usage metrics show cumulative count of Article Views (full-text article views including HTML views, PDF and ePub downloads, according to the available data) and Abstracts Views on Vision4Press platform.
Data correspond to usage on the plateform after 2015. The current usage metrics is available 48-96 hours after online publication and is updated daily on week days.
Initial download of the metrics may take a while.