Fig. 7
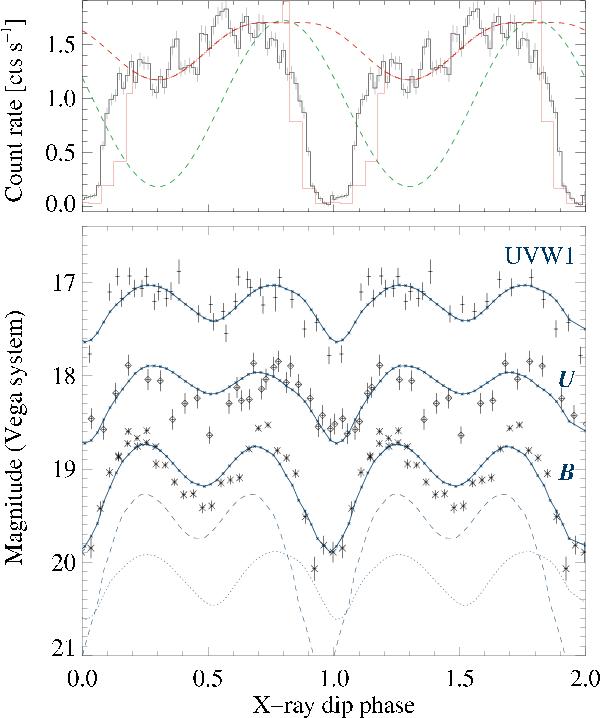
Observed (2009) and simulated light curves of RS Cae. Upper panel: phase-averaged soft X-ray light curve in the black-body-dominated 0.1 keV ≤ E ≤ 0.5 keV band plus simulated light curves of a flat circular (dashed green) and a cylindrical (red) accretion region. The solid curve includes the absorption-dip fit described in the text. EPIC/pn time bins are 100 s. Lower panel: optical monitor UVW1 filter (shifted by − 0.7 mag), U filter, and SMARTS B-band. The dashed and dotted lines represent the cyclotron and the accretion-stream contribution to the B-band simulation, respectively. OM time bins are 300 s.
Current usage metrics show cumulative count of Article Views (full-text article views including HTML views, PDF and ePub downloads, according to the available data) and Abstracts Views on Vision4Press platform.
Data correspond to usage on the plateform after 2015. The current usage metrics is available 48-96 hours after online publication and is updated daily on week days.
Initial download of the metrics may take a while.