Fig. 6
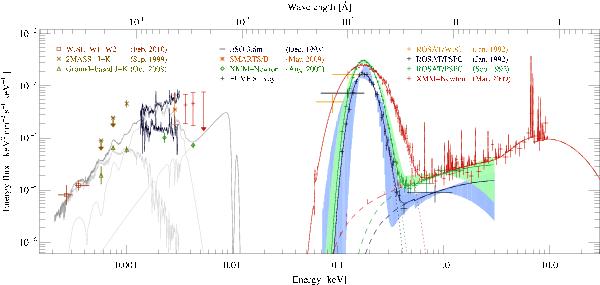
Spectral energy distribution of RS Cae during high and low states of accretion from 1992 to 2010: archival data of various missions from the infrared to the X-ray bands and our 2009 observations. The optical and UV spectroscopic and photometric data are given as orbital minimum and maximum, and 2MASS H- and K-band fluxes as upper limits. The X-ray spectra are shown with the models (solid lines) and their components (dashed and dotted). The shaded areas mark the confidence ranges of the ROSAT temperatures. The gray lines represent stellar and cyclotron model spectra (light gray), and their sum (dark gray, details are given in the text).
Current usage metrics show cumulative count of Article Views (full-text article views including HTML views, PDF and ePub downloads, according to the available data) and Abstracts Views on Vision4Press platform.
Data correspond to usage on the plateform after 2015. The current usage metrics is available 48-96 hours after online publication and is updated daily on week days.
Initial download of the metrics may take a while.