Fig. 4
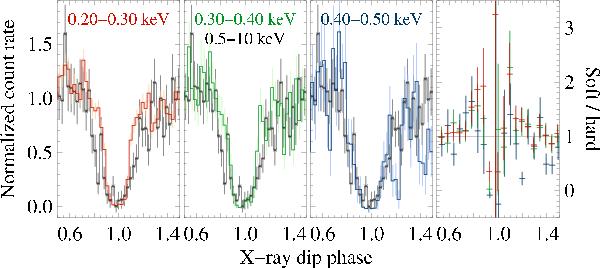
The dip in phase-averaged, energy-resolved X-ray light curves. Left to right: light curves extracted from soft X-ray energy intervals of constant width, compared to the harder 0.5−10.0 keV band. The data are binned into a time resolution of 150 s and normalized to their nondip median count rates. Right panel: corresponding ratios of X-ray soft to X-ray hard light curves, binned into a time resolution of 300 s.
Current usage metrics show cumulative count of Article Views (full-text article views including HTML views, PDF and ePub downloads, according to the available data) and Abstracts Views on Vision4Press platform.
Data correspond to usage on the plateform after 2015. The current usage metrics is available 48-96 hours after online publication and is updated daily on week days.
Initial download of the metrics may take a while.