Fig. 1
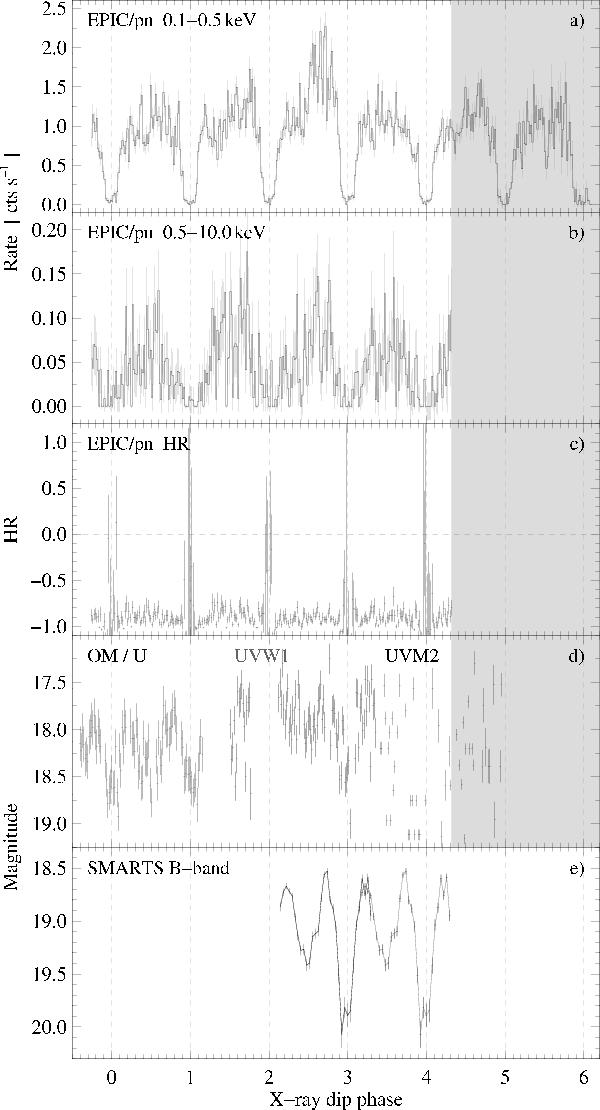
September 2009 light curves of RS Cae in time bins of 100 s, folded on the orbital period with the center of the X-ray dips defining phase zero (Eq. (1)). The grey area marks the interval of high background activity during the XMM-Newton pointing. a)–b) Energy-resolved EPIC/pn light curves. c) Corresponding hardness ratios HRXMM = (HX − SX)/(HX + SX). d) Optical and ultraviolet light curves measured subsequently with three filters at the optical monitor. e) Optical B-band light curve with a time resolution of about 227 s, plotted twice and shifted by − 3 and − 2 orbital cycles, respectively.
Current usage metrics show cumulative count of Article Views (full-text article views including HTML views, PDF and ePub downloads, according to the available data) and Abstracts Views on Vision4Press platform.
Data correspond to usage on the plateform after 2015. The current usage metrics is available 48-96 hours after online publication and is updated daily on week days.
Initial download of the metrics may take a while.