Fig. 6
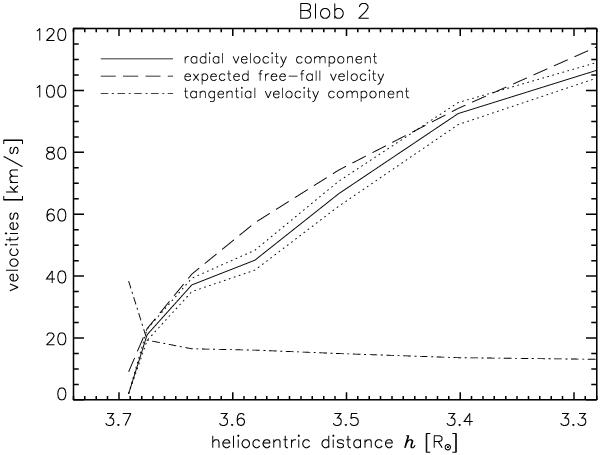
Falling velocities along the blob 2 trajectory. The plot shows that the radial velocity component (solid line) remains smaller than the expected free-fall velocity (dashed line), even if it ranges between its upper and lower limits (dotted lines), and that the tangential velocity component (dash-dotted line) decreases at lower altitudes, and a tangential deceleration may be derived.
Current usage metrics show cumulative count of Article Views (full-text article views including HTML views, PDF and ePub downloads, according to the available data) and Abstracts Views on Vision4Press platform.
Data correspond to usage on the plateform after 2015. The current usage metrics is available 48-96 hours after online publication and is updated daily on week days.
Initial download of the metrics may take a while.