Fig. 7
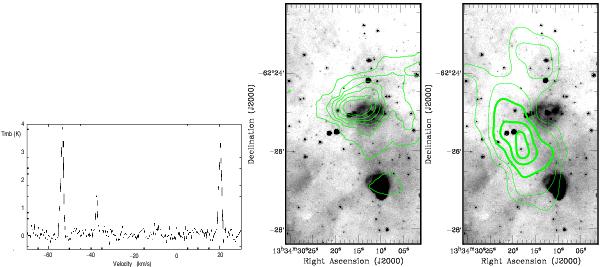
Left panel: 13CO spectrum at the center of the molecular gas at +20 km s-1 (RA, Dec(J2000) = (13h34m17.2s, –62°25′)). Intensity is expressed as main-beam brightness temperatures. Middle panel: overlay of the integrated emission of the 13CO(2–1) line within the velocity interval from +19.5 to +21.5 km s-1 and the emission at 8 μm from IRAC. Contours are 0.5 to 4.0 K km s-1 in steps of 0.6 K km s-1. Right panel: overlay of the integrated emission in the velocity interval from –37.7 to –37.0 km s-1 and the emission at 8 μm. Contours are 0.39, 0.46, 1.3, 2.0, and 2.6 K km s-1.
Current usage metrics show cumulative count of Article Views (full-text article views including HTML views, PDF and ePub downloads, according to the available data) and Abstracts Views on Vision4Press platform.
Data correspond to usage on the plateform after 2015. The current usage metrics is available 48-96 hours after online publication and is updated daily on week days.
Initial download of the metrics may take a while.