Fig. 6
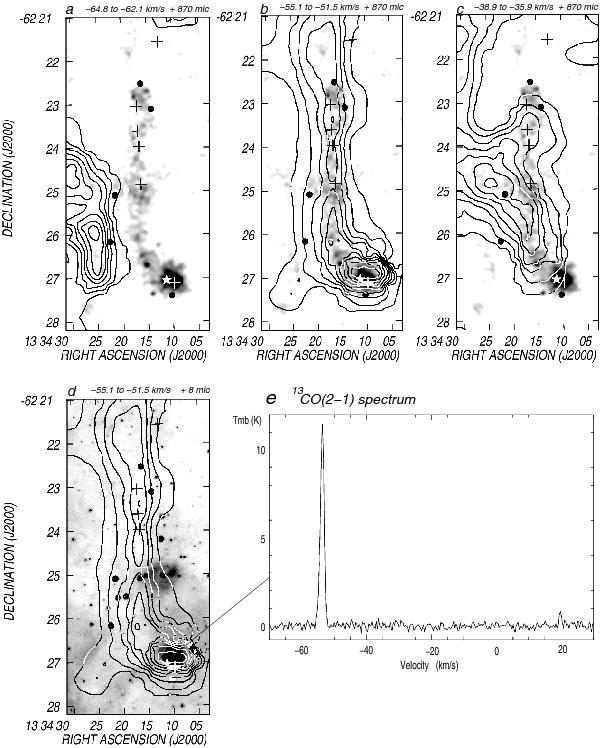
Overlay of the integrated emission of the 13CO(2–1) line within selected velocity intervals (indicated in the upper part of each panel) in contours and the LABOCA image at 870 μm in grayscale. Panel a) contour lines are from 0.5 to 3.5 K km s-1 in steps of 0.5 K km s-1. Panel b) contours are from 1.5 to 12.0 K km s-1 in steps of 1.5 K km s-1, and 14.0 K km s-1. Panel c) contours are from 0.5 to 3.5 K km s-1 in steps of 0.5 K km s-1. Panel d) overlay of the 13CO contours of panel b) and the IRAC 8 μm emission (in grayscale). Panel e) 13CO spectrum towards the brightest region of the southern clump.
Current usage metrics show cumulative count of Article Views (full-text article views including HTML views, PDF and ePub downloads, according to the available data) and Abstracts Views on Vision4Press platform.
Data correspond to usage on the plateform after 2015. The current usage metrics is available 48-96 hours after online publication and is updated daily on week days.
Initial download of the metrics may take a while.