Fig. 3
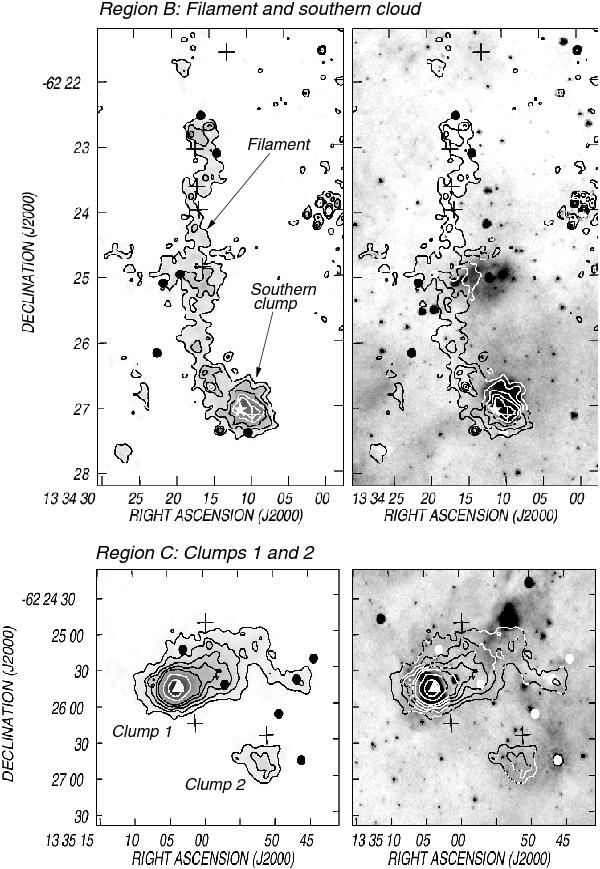
Dust emission at 870 μm corresponding to regions B and C. Upper-left panel: dust emission for the filament and the southern clump (region B) in contours and grayscale. The image is smoothed to 25′′. The grayscale goes from 10 to 150 mJy beam-1, and the contours correspond to 20 to 100 mJy beam-1 in steps of 20 mJy beam-1. The position of candidate YSOs is indicated: 2MASS sources (crosses) and Spitzer sources (filled circles) (see Sect. 6). The position of the IRAS source is indicated by a star. Upper-right panel: overlay of the IRAC emission at 8 μm in grayscale and the 870 μm image in contours. The grayscale goes from 28 to 50 MJy sr-1. Bottom-left panel: dust emission for clumps 1 and 2 (region C) in contours and grayscale. The image is smoothed to 25′′. The grayscale goes from 10 to 500 mJy beam-1, and contours correspond to 40 to 200 mJy beam-1 in steps of 40 mJy beam-1, and 300 and 400 mJy beam-1. Bottom-right panel: overlay of the IRAC emission at 8 μm in grayscale and the 870 μm image in contours. The grayscale goes from 28 to 50 MJy sr-1. The symbols have the same meaning as in the upper panels. The position of the candidate CHII region is marked by a triangle.
Current usage metrics show cumulative count of Article Views (full-text article views including HTML views, PDF and ePub downloads, according to the available data) and Abstracts Views on Vision4Press platform.
Data correspond to usage on the plateform after 2015. The current usage metrics is available 48-96 hours after online publication and is updated daily on week days.
Initial download of the metrics may take a while.