Fig. 1
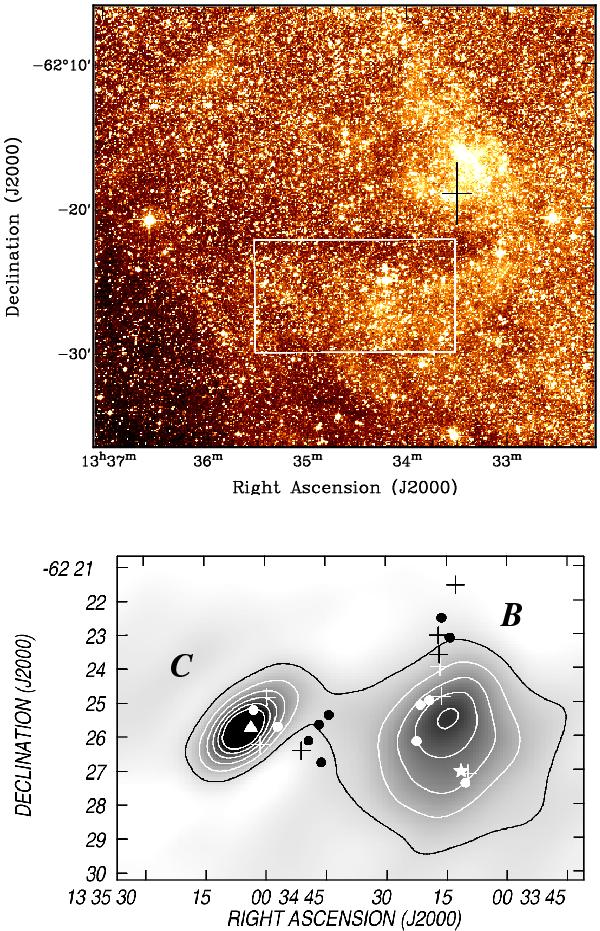
Upper panel: DSS-R image of RCW 78. The cross marks the position of the WR star. The box encloses the two star-forming regions analyzed in this paper. Bottom panel: the two star-forming regions at 60 μm (IRAS data). The grayscale goes from 200 to 500 MJy sr-1, and the contour lines are from 240 to 300 MJy sr-1 in steps of 20 MJy sr-1, and from 350 to 500 MJy sr-1 in steps of 50 MJy sr-1. Regions B and C are indicated. The different symbols mark the location of candidate YSOs identified in Sect. 6: IRAS (star), CHII (triangle), 2MASS sources (crosses), and Spitzer sources (filled circles).
Current usage metrics show cumulative count of Article Views (full-text article views including HTML views, PDF and ePub downloads, according to the available data) and Abstracts Views on Vision4Press platform.
Data correspond to usage on the plateform after 2015. The current usage metrics is available 48-96 hours after online publication and is updated daily on week days.
Initial download of the metrics may take a while.