| Issue |
A&A
Volume 562, February 2014
|
|
|---|---|---|
| Article Number | A64 | |
| Number of page(s) | 10 | |
| Section | Extragalactic astronomy | |
| DOI | https://doi.org/10.1051/0004-6361/201220851 | |
| Published online | 06 February 2014 | |
Why are some BL Lacertaes detected by Fermi, but others not?⋆
1
College of Science, Guizhou University,
550025
Guiyang,
PR China
e-mail:
This email address is being protected from spambots. You need JavaScript enabled to view it.
2
Key Laboratory for Research in Galaxies and Cosmology, Shanghai
Astronomical Observatory, Chinese Academy of Sciences, 80 Nandan Road, 200030
Shanghai, PR
China
Received: 5 December 2012
Accepted: 31 December 2013
Abstract
By cross-correlating an archival sample of 170 BL Lacs with a 2 year Fermi/LAT AGN sample, we have compiled a sample of 100 BL Lacs with Fermi detection (FBLs) and a sample of 70 non-Fermi BL Lacs (NFBLs). We compared various parameters of FBLs with those of NFBLs, including the redshift, the low-frequency radio luminosity at 408 MHz (L408 MHz), the absolute magnitude of host galaxies (Mhost), the polarization fraction from the NVSS survey (PNVSS), the observed arcsecond scale radio core flux at 5 GHz (Fcore), and the jet Doppler factor. All these parameters are directly measured or derived from available data in the literature. We found that the Doppler factor is on average greater in FBLs than in NFBLs, and the Fermi γ-ray detection rate is higher in sources with higher Doppler factor. In contrast, there are no significant differences in terms of the intrinsic parameters of redshift, L408 MHz, Mhost, and PNVSS. FBLs seem to have a higher probability of exhibiting measurable proper motion. These results strongly indicate a stronger beaming effect in FBLs compared to NFBLs. The radio core flux is found to be strongly correlated with γ-ray flux, which remains after excluding the common dependence of the Doppler factor. At the fixed Doppler factor, FBLs have systematically larger radio core flux than NFBLs, implying lower γ-ray emission in NFBLs since the radio and γ-ray flux are significantly correlated. Our results indicate that the Doppler factor is an important parameter of γ-ray detection, that the non-detection of γ-ray emission in NFBLs is probably due to low beaming and/or low intrinsic γ-ray flux, and the γ-rays are very likely produced cospatially with the arcsecond-scale radio core radiation and mainly through the SSC process.
Key words: galaxies: active / BL Lacertae objects: general / galaxies: jets / galaxies: nuclei
Tables 2, 3, and Fig. 6 are available in electronic form at http://www.aanda.org
© ESO, 2014
1. Introduction
Blazars are an extreme subclass of AGNs with characteristic properties, such as rapid variability at all wavelengths, high optical polarization, apparent superluminal motion, flat radio spectra, and a broad continuum extending from the radio through the γ-rays (Urry & Padovani 1995). The distinctive characteristic of blazars is a relativistic jet oriented close to our line-of-sight. BL Lac objects are blazars with only very weak or nonexistent emission lines (equivalent width <5 Å; e.g., Scarpa & Falomo 1997).
They can be classified as different subclasses based on the synchrotron peak of their spectral energy distribution (SED), namely, low-frequency peaked BL Lac objects (LBL), intermediate objects (IBL), and high-frequency peaked BL Lac objects (HBL; Padovani & Giommi 1995). The boundaries used for this work are as follows: log νpeak < 14.5 for LBLs, 14.5 < log νpeak < 16.5 for IBLs, and log νpeak > 16.5 for HBLs (Nieppola et al. 2006). The Large Area Telescope (LAT, Atwood et al. 2009) onboard the Fermi γ-ray Space Telescope has been scanning the entire γ-ray sky approximately once every three hours since July 2008. The LAT AGN catalogs (Abdo et al. 2009, 2010; Ackermann et al. 2011) have shown that BL Lac objects have been the largest group of γ-ray sources. The most recent LAT AGN catalog is the LAT Second Catalog of AGN (2LAC; Ackermann et al. 2011). The Clean Sample (sources with single associations and not affected by analysis issues) includes 310 FSRQs, 395 BL Lacs, 24 other AGNs, and 157 of unknown type, which makes it possible to study the statistical properties of a γ-ray sample of BL Lac objcets.
KS test on properties of Fermi and non-Fermi BL Lacs.
By now, several possible answers have been proposed to the question “why are some sources γ-ray loud and others γ-ray quiet?”. Doppler boosting is believed to be one of the important explanations. Piner et al. (2012) show that sources in the Fermi/LAT Second Source Catalog (2FGL; Nolan et al. 2012) display higher apparent speeds than those that have not been detected. Pushkarev et al. (2012) also show that the Fermi AGNs have higher VLBI core flux densities and brightness temperatures and are characterized by the less steep radio spectrum of the optically thin jet emission. Linford et al. (2011, 2012) show that the LAT flat-spectrum radio quasars (FSRQs) are significantly different from the non-LAT FSRQs, while the Fermi detected BL Lacs (FBLs) tend to be generally similar to the non-Fermi BL Lacs (NFBLs); for example, there are no differences in the fraction of polarized BL Lac objects or the distributions of the polarization. Irrespective of the general similarity, some differences between FBLs and NFBLs have been found. Linford et al. (2011, 2012) report that the FBLs have longer jets and are polarized more often, but core polarization itself does not seem sufficient for separating the two populations. Alternatively, the NFBLs may enter a state where γ-ray production ceases or is at least significantly reduced. However, the sample size of NFBLs in Linford et al. (2012) is fairly small compared to FBLs, so their results may not be conclusive.
In this work, to better understand why some sources are γ-ray detected and others are not, we compared various parameters of FBLs with those of NFBLs selected from cross-correlating the sample of 170 BL Lacs in Wu et al. (2007) with the 2LAC AGN sample. The organization of this paper is as follows. The sample selection is presented in Sect. 2, the comparisons of FBLs and NFBLs are shown in Sect. 3, the discussions are given in Sect. 4, and the results are summarized in Sect. 5. Throughout the paper, we define the spectral index α as Sν ∝ ν−α, where Sν is the flux density at frequency ν, and a cosmology with H0 = 70 km s-1 Mpc-1, ΩM = 0.3, ΩΛ = 0.7 (e.g., Hinshaw et al. 2009) is adopted.
2. The sample
Nieppola et al. (2006) presented a large sample of BL Lac objects, and the authors argued that this sample is supposed to have no selection criteria (other than declination) in addition to the ones in the original surveys. From this sample, Wu et al. (2007) estimated the Doppler factor for a sample of 170 BL Lac objects using Pco5 = Pci5δ2 + α and log Pci5 = 0.62 log Pt + 8.41 derived for radio galaxies in Giovannini et al. (2001), in which Pco5 is the observed 5 GHz core luminosity, Pci5 is the intrinsic 5 GHz core luminosity, and Pt is the total radio luminosity at 408 MHz (see Wu et al. 2007, for details).
By cross-correlating the sample of 170 BL Lacs in Wu et al. (2007) with 2LAC, we define a subsample of 100 BL Lacs as the FBLs sample, which were all detected with Fermi/LAT. The remaining 70 BL Lacs are included in the NFBLs sample, since they were not detected with Fermi/LAT. Linford et al. (2012) selected samples of FBLs and NFBLs based on available VLBI images, in which the median values of the total VLBA flux density at 5 GHz are 177 mJy for FBLs and 221 mJy for 24 NFBLs, respectively. Compared to the Linford et al. (2012) sample, the median flux density of our sample is much lower (see Table 1), especially for NFBLs, and the number of our NFBLs is about three times larger than theirs.
3. The properties of FBLs and NFBLs
To explore the differences of FBLs and NFBLs, we compare various properties for two subsamples, including the redshift, the low-frequency radio luminosity at 408 MHz (L408 MHz), the absolute magnitude of host galaxies (Mhost), the polarization fraction from the NRAO VLA Sky Survey(NVSS) survey (PNVSS), the observed arcsecond-scale radio core flux at 5 GHz (Fcore), and the jet Doppler factor. The results are shown below.
3.1. The distributions for z, L408 MHz, Mhost, PNVSS
We compared several intrinsic parameters in FBLs with NFBLs, including redshift z, L408 MHz, Mhost, and PNVSS. The redshift is available in 159 BL Lacs from NED1 and new measurements in Shaw et al. (2013), including 81 FBLs and 68 NFBLs. The L408 MHz of all sources are directly adopted from Wu et al. (2007), which is the available arcsecond-scale extended flux or was estimated from the radio flux at nearest frequency. The L408 MHz is expected to be less influenced by the beaming effect because it is comparable to L408 MHz of FR I radio galaxies (Wu et al. 2007). The parameter Mhost is available in Wu et al. (2009) for 121 BL Lacs, including 69 FBLs and 52 NFBLs. We collected the fraction of the polarized flux in total flux PNVSS from NVSS, which is available for 92 FBLs and 55 NFBLs. The Kolmogorov Smirnov (KS) test shows that the distributions of FBLs and NFBLs do not show significant differences for all four parameters (see Table 1). However, the χ2-test does not show any similarities between FBLs and NFBLs in the distributions of all four parameters.
3.2. Doppler factor and radio core flux
The Doppler factor δ can directly measure the significance of jet beaming effect, and the radio core flux is usually boosted by the jet beaming effect in BL Lacs (Wu et al. 2007). These two parameters are available for all 170 BL Lacs in Wu et al. (2007). In Fig. 1, we compare the distributions of Doppler factor and the radio core flux Fcore for all BL Lacs. We find that FBLs on average have a larger Doppler factor δ and larger Fcore than NFBLs. The KS test shows that there are significant differences between the total samples of FBLs and NFBLs in distributions of Doppler factor and Fcore, all at a confidence level over 99.99% (see Table 1). The systematically higher mean and median radio core flux in FBLs indicates that the intrinsic radio core flux may be higher than in NFBLs at the fixed Doppler factor.
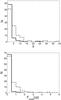 |
Fig. 1 Distributions of Doppler factor δ (top) and radio core flux Fcore (bottom) for our BL Lacs. The dashed lines are for FBLs, the solid lines for NFBLs. |
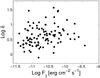 |
Fig. 2 The γ-ray flux versus Doppler factor for FBLs. |
3.3. The γ-ray flux and Doppler factor
We collected the γ-ray flux Fγ in the 100 MeV to 100 GeV range for all 100 FBLs from 2FGL. We show the relation between Fγ and δ in Fig. 2. By using Spearman-rank correlation analysis (Macklin 1982), we found a significant correlation between the Doppler factor and Fγ with correlation coefficient r = 0.296 at >99% confidence level. A strong correlation (r = 0.365 at >99.9% confidence level) is also found between δ and γ-ray luminosity Lγ. These results indicate that γ-ray emission is severely influenced by the jet beaming effect. The Doppler factor is probably an important factor responsible for detecting Fermi BL Lacs.
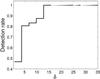 |
Fig. 3 Fermi γ-ray detection rate and Doppler factor. |
4. Discussion
BL Lac objects are believed to be beamed FR I radio galaxies, and their multiband electromagnetic radiation is related to the presence of relativistic particles in jets. Beaming is an important effect for understanding this type of object. From a large sample of BL Lacs with estimated Doppler factor (Wu et al. 2007), we find a significant difference in the Doppler factor of FBLs and NFBLs, but no significant differences in terms of several intrinsic parameters z, L408MHz, Mhost, and PNVSS. The Doppler factor of FBLs is systematically higher than those of NFBLs, implying an important role for the jet beaming effect in γ-ray detection. This systematic difference is also evident in the subsamples of LBLs and IBLs (see Table 1), but not in HBLs. However, the small number of sources precludes our drawing any firm conclusions about each subsample. Savolainen et al. (2010) used a sample consisting mostly of FSRQs and a different method of calculating the Doppler factor. They report a similar result in that Fermi-detected sources had larger Doppler factors, on average. In Fig. 3, we plot the Fermi γ-ray detection rate (i.e., the ratio of the FBLs number to total BL Lacs in bins of Doppler factor, in which we use three as the bin in Doppler factor) versus the Doppler factor. We find that the detection rate increases with Doppler factor when δ < 10, and it reaches 1.0 at δ > 10 and remains so all the way up to high δ values. This implies that sources with a smaller Doppler factor may have a lower probability of having significant γ-ray emission.
Proper motions can be used to study the bulk motion of jets when combining it with other measurements. Superluminal motion have often been observed in blazars with relativistic jets moving towards us at a small viewing angle. Piner et al. (2012) show that sources in 2FGL display higher apparent speeds than those that are not detected by Fermi. We have searched the literature and found proper motion measurements for 38 sources, consisting of 33 FBLs and 5 NFBLs (see Table 3). Therefore, the measurements rate of proper motion are ~34% for FBLs and ~7% for NFBLs. Because the source selection for proper motion observations is usually not relevant with the information of γ-ray detection, the available proper motion is hardly biased toward FBLs. The higher proper motion measurement rate in FBLs implies that the proper motion might be easier to be detected in FBLs, most likely due to the higher jet beaming effect, hence consistent with higher Doppler factor in FBLs, or the NFBLs are intrinsically dimmer.
4.1. The radio core flux and γ-ray detection of BL Lacs
Because γ-ray flux and radio core flux are Doppler-boosted, a strong correlation between them is expected, which is plotted in Fig. 4. Indeed, a significant correlation is found with a Spearman correlation coefficient of r = 0.493 at ≫99.99% level. Interestingly, the correlation is still significant even after excluding the common dependence on the Doppler factor by using the partial Spearman correlation method (Macklin 1982), with a correlation coefficient of 0.429 at ≫99.99% level. To study the nature of NFBLs further, we investigated the differences of FBLs and NFBLs in radio core flux at a fixed Doppler factor. In Fig. 5, we show the relationship between δ and the average Fcore of FBLs and NFBLs in δ bins, in which we use 1 as the bin size in δ. Intriguingly, FBLs have systematically larger radio core flux than NFBLs at fixed δ, indicating larger intrinsic radio core flux in FBLs. We separated our 100 FBLs into two subsamples based on their γ-ray flux: 50 FBLs with relatively high γ-ray flux(HG-FBLs) (larger than 1.7E-11 erg/cm2/s) and others with relatively lower γ-ray flux(LG-FBLs). We also investigated the differences of HG-FBLs and LG-FBLs in radio core flux at fixed Doppler factor similar to what we did for FBLs and NFBLs. The result is also similar with FBLs and NFBLs as shown in Fig. 5, which means that HG-FBLs also have systematically larger radio core flux than LG-FBLs at fixed δ, indicating larger intrinsic radio core flux in HG-FBLs. In combination with the correlation between Fcore and Fγ, NFBLs may have relatively smaller Fγ, even though they have comparable δ with FBLs, making them more difficult to be detected by Fermi/LAT.
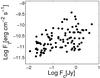 |
Fig. 4 Relation between radio core flux at 5 GHz and γ-ray flux in the 100 MeV to 100 GeV range. |
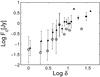 |
Fig. 5 Relation between the Doppler factor and the average radio core flux in binned δ, with errorbars showing the standard deviation of core flux in each bin. The solid and open circles stand for FBLs and NFBLs, respectively. |
From Fig. 5, it can be seen that the radio flux of NFBLs at fixed Doppler factor are systematically lower than FBLs, indicating that the γ-ray flux for NFBLs might also be lower, which probably leads to its not being detected with the Fermi Telescope. Together with the difference in δ, the non-detection of Fermi γ-ray emission in NFBLs is likely due to their smaller Doppler factor and/or lower intrinsic γ-ray flux. However, it should be noticed that the radio flux of NFBLs covers a wide range overall or in each Doppler factor bin, as shown by the large errorbar. The investigations of the differences between FBLs and NFBLs are further complicated by the fact that BL Lac objects usually exhibit violent variations. Because the γ-ray and radio emission were not observed simultaneously, the variations thus may be at least partly responsible for the large dispersion of correlation between the γ-ray and radio flux (see Fig. 4). It is highly possible that NFBLs may enter a state where γ-ray production ceases or is at least significantly reduced (Linford et al. 2012). To exclude the effect of variations, the simultaneous observations at γ-ray and other wavebands are required for larger samples of BL Lac objects, especially in radio bands.
There are two popular models for the γ-ray emission mechanism of blazars, the synchrotron self-Compton model (SSC, seed photons from synchrotron radiation) and external-radiation-Compton (ERC, seed photons from external region) (Chen & Bai 2011). Typically, the ERC scenario requires that the inverse Compton (IC) radiation, i.e., γ-rays, originate relatively close to center, within the central parsec, while SSC γ-rays come from jets beyond a parsec’s distance (Nieppola et al. 2011). Our results have shown that the non-detection of γ-ray is most likely related to lower intrinsic radio core flux, which originated in the jet synchrotron emission. The close realtions of γ-ray to radio emission may support the view of Nieppola et al. (2011) that γ-rays are produced cospatially with the arcsecond-scale radio core radiation, indicating that the γ-ray is probably produced mainly through the SSC process in our sample.
4.2. Effects of radio variability
BL Lacs are known to show significant and rapid variations at nearly all wavebands. The effects of variations might be nontrivial in our results since the radio and γ-ray emission were not observed simultaneously. Although the γ-ray flux are variable, there should be little concern about short-term variability since the 2FGL data are basically averaged over about two years. In this section, we only present the effects of radio variability on our statistical results.
The detailed variations for each source are basically unknown, so we then have to make assumptions on the source state. We considered that 30% or 50% of sources were in an elevated state with radio core flux or luminosity at 120% to 200% of the quiescent level. These 30% or 50% of sources were selected in three ways: (1) at highest radio flux; (2) at highest luminosity; and (3) as random sources (see Table 2). We recalculated the Doppler factor with newly assigned radio-core quiescent flux or luminosity. The KS tests show that there are still significant differences between FBLs and NFBLs in distributions of Doppler factor and Fcore in all three circumstances (see Table 2). This strongly implies that the variability may not alter our results.
Alternatively, we investigated how much the variations are needed to eliminate the systematic difference between FBLs and NFBLs in δ and Fcore distributions. Because the δ and Fcore for FBLs are on average much higher than NFBLs (see the mean and median values in Table 1), we assume that the differences are totally due to the elevated state in FBLs during radio observation. Based on the mean values (see Table 1), we found that the significant differences disappear (the probability less than 90% from KS test), when we systematically reduce a factor of 1.7−1.9 for δ and a factor of 6−9 for Fcore for FBLs. This means that the FBLs are expected to be in a flare state with flux density of a factor of 6−9 higher on average than the quiescent state, if the systematic differences between FBLs and NFBLs are caused completely by variations. However, the typical maximum variations are found to be around a factor of two, for invividual sources such as BL Lac (Villata et al. 2009) and S5 0716+714 (Rani et al. 2013), or for the light curves of BL Lac objects in the University of Michigan Radio Astronomy Observatory (UMRAO) database2. Therefore, the systematically differences between FBLs and NFBLs cannot be caused by the variations alone.
We also considered core flux variations within a factor of two in each source, corresponding to δ variations within a factor of  (Giroletti et al. 2004). We let δ of each object vary randomly between
  and δ/ with a step size of 1%. The KS tests on one million samples with allocated δ values show that there is still a significant difference between FBLs and NFBLs in the δ distribution (confidence level greater than 99.8%). By varying the core flux, a significant difference is also found between FBLs and NFBLs in the Fcore distribution (confidence level over 99.9%). We therefore are confident that the variations in the radio core flux will not significantly change our results.
We also tested the strong correlations of δ-Fγ, δ-Lγ, and Fγ-Fcore by varying Fcore randomly with a factor within [1/2, 2] and δ within [1/,]. On a million designed FBLs samples, we found that the significant correlations persist in almost all samples.
In summary, we argue that the variations in the radio core flux density will not affect our results based on the various considerations above.
5. Summary
By using the available data, we have compared various parameters of FBLs with those of NFBLs . We found that the Doppler factor is on average greater in FBLs than in NFBLs, and the Fermi γ-ray detection rate is higher in sources with greater Doppler factor. The arcsecond-scale radio core flux of NFBLs is on average lower than the FBLs at a fixed doppler factor. Our results indicate that the Doppler factor is an important parameter for γ-ray detection. It seems that variations in the radio core flux density will not affect our results. The non-detection of γ-ray emission in NFBLs is very likely due to low beaming and/or low intrinsic γ-ray flux and the γ-rays seems to be produced cospatially with the arcsecond-scale radio core radiation, and is probably produced mainly through the SSC process.
Because our sample is limited by the available archival data, and the estimation of Doppler factor is based on an empirical relation, the future new observational data including redshift,
arcsecond scale radio data, and new improved estimations of Doppler factor for larger samples of BL Lac objects will all be useful for further tests of our results. Additionally, the new observations of BL Lac sample with less beaming effect using Very-Long-Baseline Interferometry(VLBI) technique and at other wavelengths will be also important for understanding the nature of BL Lacs, and also helpful for testing our results further.
Online material
KS test for the variation effects on Fermi and non-Fermi BL Lacs.
Sample of 170 BL Lac objects in Wu et al. (2007).
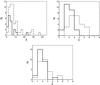 |
Fig. 6 Distributions of Doppler factor δ for LBL (top Left), IBL (top right), and HBLs (bottom). The dashed lines are for FBLs, and solid lines for NFBLs. |
Acknowledgments
We thank the anonymous referee and editor for insightful comments and constructive suggestions, which were very helpful for improving our paper. We thank Emmanouil Papastergis for helpful discussions. This work is supported by the 973 Program (No. 2009CB824800), the NSFC grants (Nos. 11163002, 11073039, 11103060, 11233006, 11173043), and by the Study Abroad Fund from China Scholarship Council (No.[2011]5024).
References
- Abdo, A. A., Ackermann, M., Ajello, M., et al. 2009, ApJ, 700, 597 [NASA ADS] [CrossRef] [Google Scholar]
- Abdo, A. A., Ackermann, M., Ajello, M., et al. 2010, ApJ, 715, 429 [NASA ADS] [CrossRef] [Google Scholar]
- Ackermann, M., Ajello, M., Allafort, A., et al. 2011, ApJ, 743, 171 [NASA ADS] [CrossRef] [Google Scholar]
- Atwood, W. B., Abdo, A. A., Ackermann, M., et al. 2009, ApJ, 697, 1071 [NASA ADS] [CrossRef] [Google Scholar]
- Chen, L., & Bai, J. M. 2011, ApJ, 735, 108 [NASA ADS] [CrossRef] [Google Scholar]
- Gabuzda, D. C., Pushkarev, A. B., & Cawthorne, T. V. 2000, MNRAS, 319, 1109 [NASA ADS] [CrossRef] [Google Scholar]
- Giovannini, G., Cotton, W. D., Feretti, L., Lara, L., & Venturi, T. 2001, ApJ, 552, 508 [NASA ADS] [CrossRef] [Google Scholar]
- Hinshaw, G., Weiland, J. L., Hill, R. S., et al. 2009, ApJS, 180, 225 [NASA ADS] [CrossRef] [Google Scholar]
- Giroletti, M., Giovannini, G., Taylor, G. B., & Falomo, R. 2004, ApJ, 613, 752 [NASA ADS] [CrossRef] [Google Scholar]
- Jorstad, S. G., Marscher, A. P., Mattox, J. R., et al. 2001, ApJ, 134, 181 [Google Scholar]
- Kellermann, K. I., Lister, M. L., Homan, D. C., et al. 2004, ApJ, 609, 539 [NASA ADS] [CrossRef] [Google Scholar]
- Kharb, P., Gabuzda, D., Shastri, P., et al. 2008, MNRAS, 384, 230 [NASA ADS] [CrossRef] [Google Scholar]
- Kharb, P., Lister, M. L., & Cooper, N. J. 2010, ApJ, 710, 764 [NASA ADS] [CrossRef] [Google Scholar]
- Linford, J. D., Taylor, G. B., Romani, R., et al. 2011, ApJ, 726, 16 [NASA ADS] [CrossRef] [Google Scholar]
- Linford, J. D., Taylor, G. B., Romani, R., et al. 2012, ApJ, 744, 177 [NASA ADS] [CrossRef] [Google Scholar]
- Lister, M. L., Homan, D. C., & Kadler, M. 2009, ApJ, 696, 22 [Google Scholar]
- Macklin, J. T. 1982, MNRAS, 199, 1119 [NASA ADS] [Google Scholar]
- Nieppola, E., Tornikoski, M., & Valtaoja, E. 2006, A&A, 445, 441 [NASA ADS] [CrossRef] [EDP Sciences] [Google Scholar]
- Nieppola, E., Tornikoski, M., & Valtaoja, E. 2011, A&A, 535, A69 [NASA ADS] [CrossRef] [EDP Sciences] [Google Scholar]
- Nolan, P. L., et al. 2012, ApJS, 199, 31 [NASA ADS] [CrossRef] [Google Scholar]
- Padovani, P., & Giommi, P. 1995, ApJ, 446, 547 [Google Scholar]
- Piner, B. G., Bhattarai, D., Edwards, P. G., & Jones, D. L. 2006, ApJ, 640, 196 [NASA ADS] [CrossRef] [Google Scholar]
- Piner, B. G., Pushkarev, A. B., Kovalev, Y. Y., et al. 2012, ApJ, 758, 84 [NASA ADS] [CrossRef] [Google Scholar]
- Pushkarev, A. B., & Kovalev, Y. Y. 2012, A&A, 544, A34 [NASA ADS] [CrossRef] [EDP Sciences] [Google Scholar]
- Rani, B., Krichbaum, T. P., Fuhrmann, L., et al. 2013, A&A, 552, A11 [NASA ADS] [CrossRef] [EDP Sciences] [Google Scholar]
- Savolainen, T., Homan, D. C., Hovatta, T., et al. 2010, A&A, 512, A24 [NASA ADS] [CrossRef] [EDP Sciences] [Google Scholar]
- Shaw, M. S., Romani, R. W., Cotter, G., et al. 2013, ApJ, 764, 135 [NASA ADS] [CrossRef] [Google Scholar]
- Urry, C. M., & Padovani, P. 1995, PASP, 107, 803 [NASA ADS] [CrossRef] [Google Scholar]
- Villata, M., Raiteri, C. M., Larionov, V. M., et al. 2009, A&A, 501, 455 [NASA ADS] [CrossRef] [EDP Sciences] [Google Scholar]
- Wu, Z. Z., Jiang, D. R., Gu, M. F., & Liu, Y. 2007, A&A, 466, 63 [NASA ADS] [CrossRef] [EDP Sciences] [Google Scholar]
- Wu, Z. Z., Gu, M. F., & Jiang, D. R. 2009, Res. Astron. Astrophys., 9, 168 [NASA ADS] [CrossRef] [Google Scholar]
- Wu, Z. Z., Jiang, D. R., & Gu, M. F. 2012, MNRAS, 424, 2733 [NASA ADS] [CrossRef] [Google Scholar]
All Tables
All Figures
|
Fig. 1 Distributions of Doppler factor δ (top) and radio core flux Fcore (bottom) for our BL Lacs. The dashed lines are for FBLs, the solid lines for NFBLs. |
| In the text | |
|
Fig. 2 The γ-ray flux versus Doppler factor for FBLs. |
| In the text | |
|
Fig. 3 Fermi γ-ray detection rate and Doppler factor. |
| In the text | |
|
Fig. 4 Relation between radio core flux at 5 GHz and γ-ray flux in the 100 MeV to 100 GeV range. |
| In the text | |
|
Fig. 5 Relation between the Doppler factor and the average radio core flux in binned δ, with errorbars showing the standard deviation of core flux in each bin. The solid and open circles stand for FBLs and NFBLs, respectively. |
| In the text | |
|
Fig. 6 Distributions of Doppler factor δ for LBL (top Left), IBL (top right), and HBLs (bottom). The dashed lines are for FBLs, and solid lines for NFBLs. |
| In the text | |
Current usage metrics show cumulative count of Article Views (full-text article views including HTML views, PDF and ePub downloads, according to the available data) and Abstracts Views on Vision4Press platform.
Data correspond to usage on the plateform after 2015. The current usage metrics is available 48-96 hours after online publication and is updated daily on week days.
Initial download of the metrics may take a while.