Fig. 3
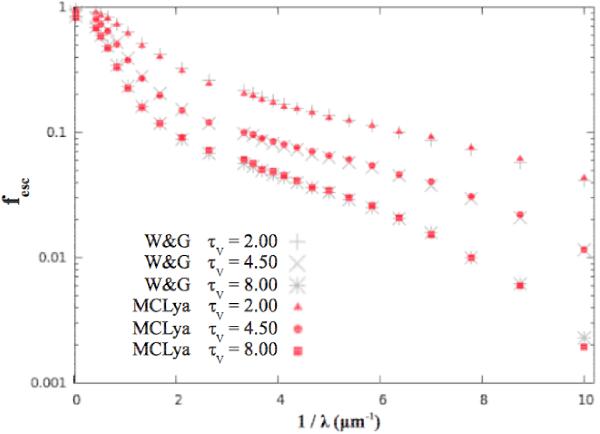
Comparison of the UV-to-optical continuum escape fraction derived from our code with the results of Witt & Gordon (2000). The clumpy shell geometry studied here is built on a Cartesian grid of N = 303 cells and is characterized by the following parameters: FF = 0.15, nIC/nC = 0.01, Rmin = 5, and Rmax = 15. The evolution of the escape fraction at 25 different wavelengths is shown, from λ = 0.1 μm to λ = 30 μm, assuming three different dust optical depths τV in the shell structure (measured in V band): τV = 2, 4.5, and 8. The escape fractions obtained with MCLyα are marked in red, whereas those obtained by Witt & Gordon (2000) are marked in grey. We find very good agreement with Witt & Gordon (2000).
Current usage metrics show cumulative count of Article Views (full-text article views including HTML views, PDF and ePub downloads, according to the available data) and Abstracts Views on Vision4Press platform.
Data correspond to usage on the plateform after 2015. The current usage metrics is available 48-96 hours after online publication and is updated daily on week days.
Initial download of the metrics may take a while.