Fig. 21
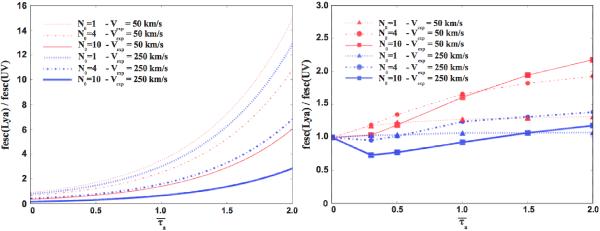
Evolution of the Lyα line-to-continuum escape fractions ratio,
fesc(Lyα)/fesc(UV),
as a function of the dust optical depth  in six different extremely clumpy shell geometries. The left panel
illustrates the results of HO06 (Fig. 18 of their paper), whereas the
right panel shows those of our own simulations. Note the
different vertical scales. Each clumpy shell geometry is characterized by different
values of N0 and is built with a different set of
parameters. Both structures showing N0 = 1 (dotted
lines) are built by adopting FF = 0.10, CF = 0.38,
nIC/nC
= 0, T = 104 K,
in six different extremely clumpy shell geometries. The left panel
illustrates the results of HO06 (Fig. 18 of their paper), whereas the
right panel shows those of our own simulations. Note the
different vertical scales. Each clumpy shell geometry is characterized by different
values of N0 and is built with a different set of
parameters. Both structures showing N0 = 1 (dotted
lines) are built by adopting FF = 0.10, CF = 0.38,
nIC/nC
= 0, T = 104 K,  = 1022/cm-2, and vexp = 50, 250 km s-1.
Both structures showing N0 = 4 (dashed-dotted lines) are
built adopting FF = 0.15, CF = 0.70,
nIC/nC
= 0, T = 104 K, =1022
cm-2, and vexp = 50, 250 km s-1.
Finally, both geometries showing N0 = 10 (solid lines)
are built with FF = 0.13, CF = 0.90,
nIC/nC
= 0, T = 104 K, =1022
cm-2, and vexp = 50, 250 km s-1.
In the left panel, each curve is obtained by assuming
fesc(UV) given by Eq. (17) and, respectively,
fesc(Lyα) = (0.94; 0.68; 0.38) for 50
km s-1 and (0.81; 0.43; 0.18) for 250 km s-1 in all clumpy
media (N0 = 1;4;10). Conversely, all curves shown in the
right panel are derived from full Monte Carlo simulations. As in
HO06, the Lyα escape fraction is derived in our simulations at the
line centre (i.e. the intrinsic Lyα line is described as a delta
function in all simulations).
= 1022/cm-2, and vexp = 50, 250 km s-1.
Both structures showing N0 = 4 (dashed-dotted lines) are
built adopting FF = 0.15, CF = 0.70,
nIC/nC
= 0, T = 104 K, =1022
cm-2, and vexp = 50, 250 km s-1.
Finally, both geometries showing N0 = 10 (solid lines)
are built with FF = 0.13, CF = 0.90,
nIC/nC
= 0, T = 104 K, =1022
cm-2, and vexp = 50, 250 km s-1.
In the left panel, each curve is obtained by assuming
fesc(UV) given by Eq. (17) and, respectively,
fesc(Lyα) = (0.94; 0.68; 0.38) for 50
km s-1 and (0.81; 0.43; 0.18) for 250 km s-1 in all clumpy
media (N0 = 1;4;10). Conversely, all curves shown in the
right panel are derived from full Monte Carlo simulations. As in
HO06, the Lyα escape fraction is derived in our simulations at the
line centre (i.e. the intrinsic Lyα line is described as a delta
function in all simulations).
Current usage metrics show cumulative count of Article Views (full-text article views including HTML views, PDF and ePub downloads, according to the available data) and Abstracts Views on Vision4Press platform.
Data correspond to usage on the plateform after 2015. The current usage metrics is available 48-96 hours after online publication and is updated daily on week days.
Initial download of the metrics may take a while.