Fig. 5
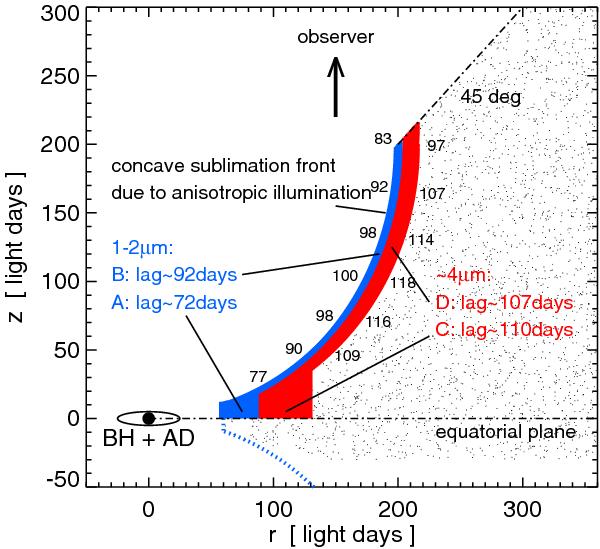
Schematic illustration of the dust torus model by Kawaguchi & Mori. Blue denotes hot T ~ 1600 K dust visible at 1−2 μm, red denotes cooler T ~ 800 K dust visible at ~4 μm. The single black numbers left and right of the rim give the lags along the torus rim at 1−2 μm and at ~4 μm, respectively. Note the foreshortening of the lags in the high-altitude part of the torus rim. The mean lags of the equatorial zones (A and C) and the entire 2π integrated torus rim (B and D) are given, adopting a constant dust density distribution along the rim.
Current usage metrics show cumulative count of Article Views (full-text article views including HTML views, PDF and ePub downloads, according to the available data) and Abstracts Views on Vision4Press platform.
Data correspond to usage on the plateform after 2015. The current usage metrics is available 48-96 hours after online publication and is updated daily on week days.
Initial download of the metrics may take a while.