Fig. 4
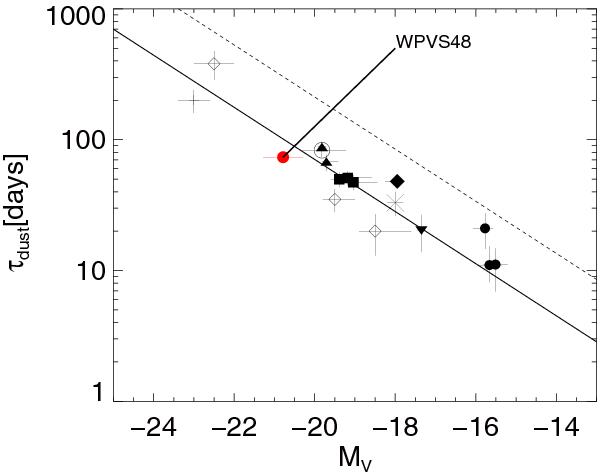
Lag–luminosity relationship based on the data of Suganuma et al. (2006). The symbols for individual Seyfert 1 galaxies are the same as in Suganuma et al. (2006). The solid line is the best-fit regression from Suganuma et al. (2006). WPVS48 (red dot) lies close to the regression line. The dashed line indicates the dust sublimation radius rsub expected at a given nuclear luminosity MV (from Kishimoto et al. 2007).
Current usage metrics show cumulative count of Article Views (full-text article views including HTML views, PDF and ePub downloads, according to the available data) and Abstracts Views on Vision4Press platform.
Data correspond to usage on the plateform after 2015. The current usage metrics is available 48-96 hours after online publication and is updated daily on week days.
Initial download of the metrics may take a while.