Fig. 2
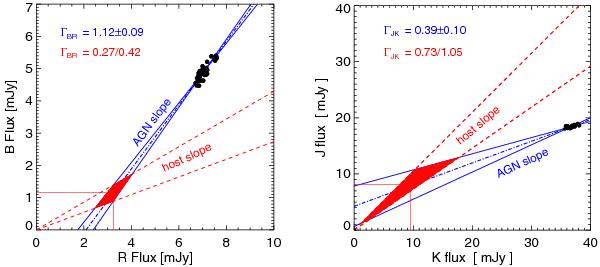
Flux variation gradient diagrams of WPVS48 in the optical (left) and NIR (right). The data are represented by the black dots. The solid blue lines represent the bisector fit, yielding the range of the AGN slopes. The dashed red lines indicate the range of host slopes determined in the optical by Sakata et al. (2010) and the NIR by Suganuma et al. (2006). The intersection between the host galaxy and AGN slope (red area) gives the host galaxy flux in the respective bands.
Current usage metrics show cumulative count of Article Views (full-text article views including HTML views, PDF and ePub downloads, according to the available data) and Abstracts Views on Vision4Press platform.
Data correspond to usage on the plateform after 2015. The current usage metrics is available 48-96 hours after online publication and is updated daily on week days.
Initial download of the metrics may take a while.