Fig. 6
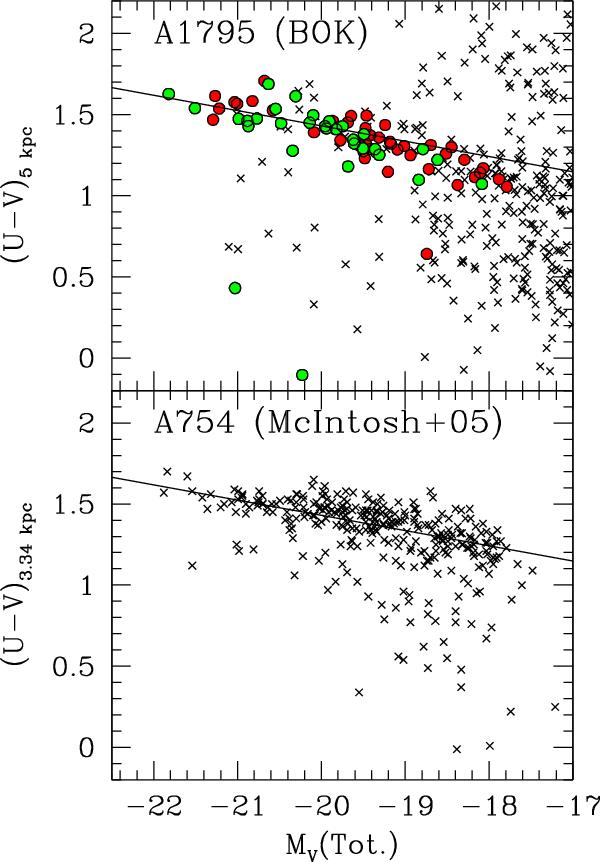
Color–magnitude diagram (U − V) − MV for Abell 1795 (this work) and for Abell 754 (McIntosh et al. 2005). The straight lines in the plots correspond to the best-fit parameters given for Abell 754 in Table 8 of McIntosh et al. (2005) last row. The red and green dots in the upper panel, respectively mark elliptical and S0 galaxies that are spectroscopically confirmed members of the cluster Abell 1795.
Current usage metrics show cumulative count of Article Views (full-text article views including HTML views, PDF and ePub downloads, according to the available data) and Abstracts Views on Vision4Press platform.
Data correspond to usage on the plateform after 2015. The current usage metrics is available 48-96 hours after online publication and is updated daily on week days.
Initial download of the metrics may take a while.