Fig. 2
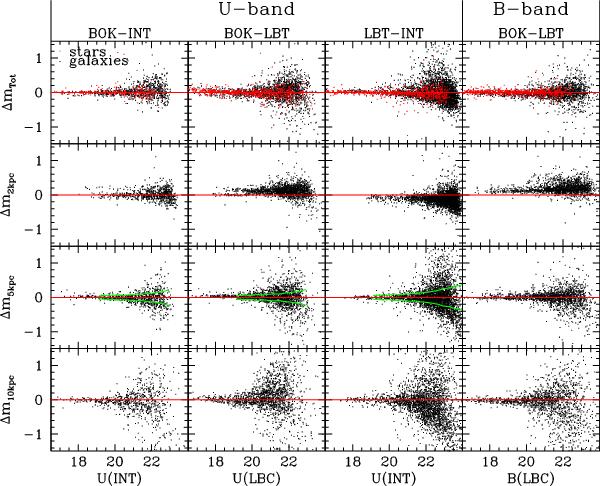
Differences between magnitudes obtained using different cameras for common galaxies (black dots) as a function of magnitude. The plots in the topmost row of the figure refer to the total magnitudes, while those in the remaining rows refer to the magnitudes within circular apertures of radii 2, 5, and 10 kpc, top to bottom. The plots in the rightmost column of the figure refer to the B-band, while those in the other columns refer to the U-band. The red dots in the plots of the topmost row of the figure (total magnitudes) refer to the stars. The green curves in the plots relative to the 5 kpc apertures (third row of the figure) illustrate the rms expected according to the formulas reported in the headers of the catalogs (see text for details).
Current usage metrics show cumulative count of Article Views (full-text article views including HTML views, PDF and ePub downloads, according to the available data) and Abstracts Views on Vision4Press platform.
Data correspond to usage on the plateform after 2015. The current usage metrics is available 48-96 hours after online publication and is updated daily on week days.
Initial download of the metrics may take a while.