Free Access
Fig. 7
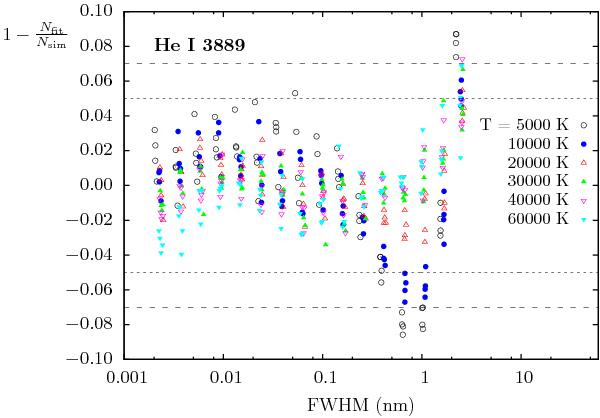
Relative differences between the results obtained from applying the fitting formula proposed in this work and the direct data from the simulation calculation for the He I 3889 line. Difference bands of 5% and 8% are shown.
Current usage metrics show cumulative count of Article Views (full-text article views including HTML views, PDF and ePub downloads, according to the available data) and Abstracts Views on Vision4Press platform.
Data correspond to usage on the plateform after 2015. The current usage metrics is available 48-96 hours after online publication and is updated daily on week days.
Initial download of the metrics may take a while.