Fig. 12
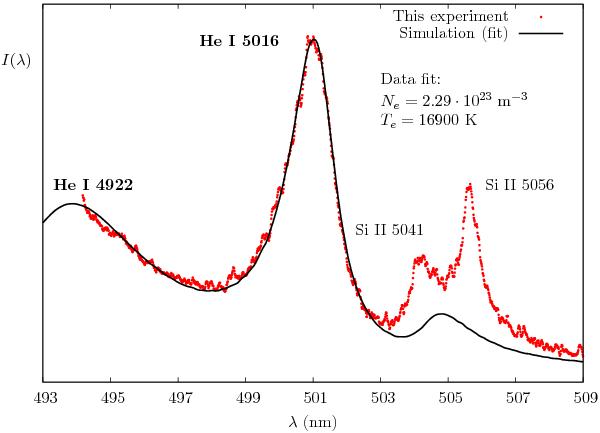
Electron density determination using the simulation fit to the He I 5016 experimental line profile. The relative intensities of the He I 5016 and He I 4922 lines, which can be observed on the left side of the figure, are used as fit parameters. The electron temperature has been taken from the Boltzmann-plot of the Si II lines. This measurement is similar to the one represented in Fig. 11, but here the best fit with He I 5016 is sought.
Current usage metrics show cumulative count of Article Views (full-text article views including HTML views, PDF and ePub downloads, according to the available data) and Abstracts Views on Vision4Press platform.
Data correspond to usage on the plateform after 2015. The current usage metrics is available 48-96 hours after online publication and is updated daily on week days.
Initial download of the metrics may take a while.