Fig. 11
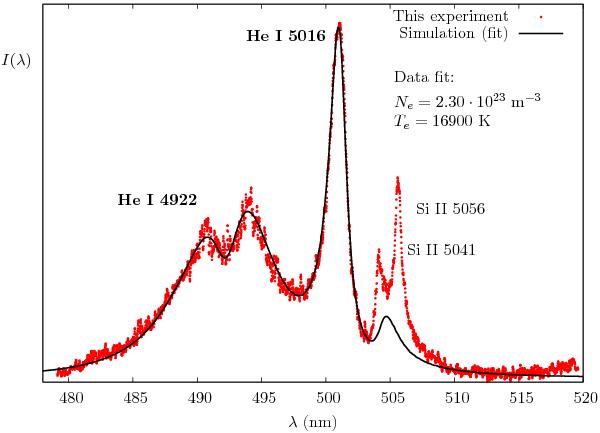
Fit of the experimental He I 4922 line spectrum and result of the simulation. The electron temperature has been taken from the Boltzmann-plot of the Si II lines. This line overlaps with the He I 5016 line. The best fit for the He I 4922 line has been found by taking the electron density of the plasma and the relative intensities of both lines as fit parameters. The fit of He I 5016 has not been sought, it arises in a natural way from the value of Ne set by the line 4922. The two spectral lines that appear on the right side of the figure, above the forbidden component of He I 5016, arise from Silicon impurities.
Current usage metrics show cumulative count of Article Views (full-text article views including HTML views, PDF and ePub downloads, according to the available data) and Abstracts Views on Vision4Press platform.
Data correspond to usage on the plateform after 2015. The current usage metrics is available 48-96 hours after online publication and is updated daily on week days.
Initial download of the metrics may take a while.