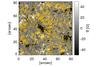
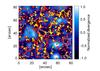
Fig. 1
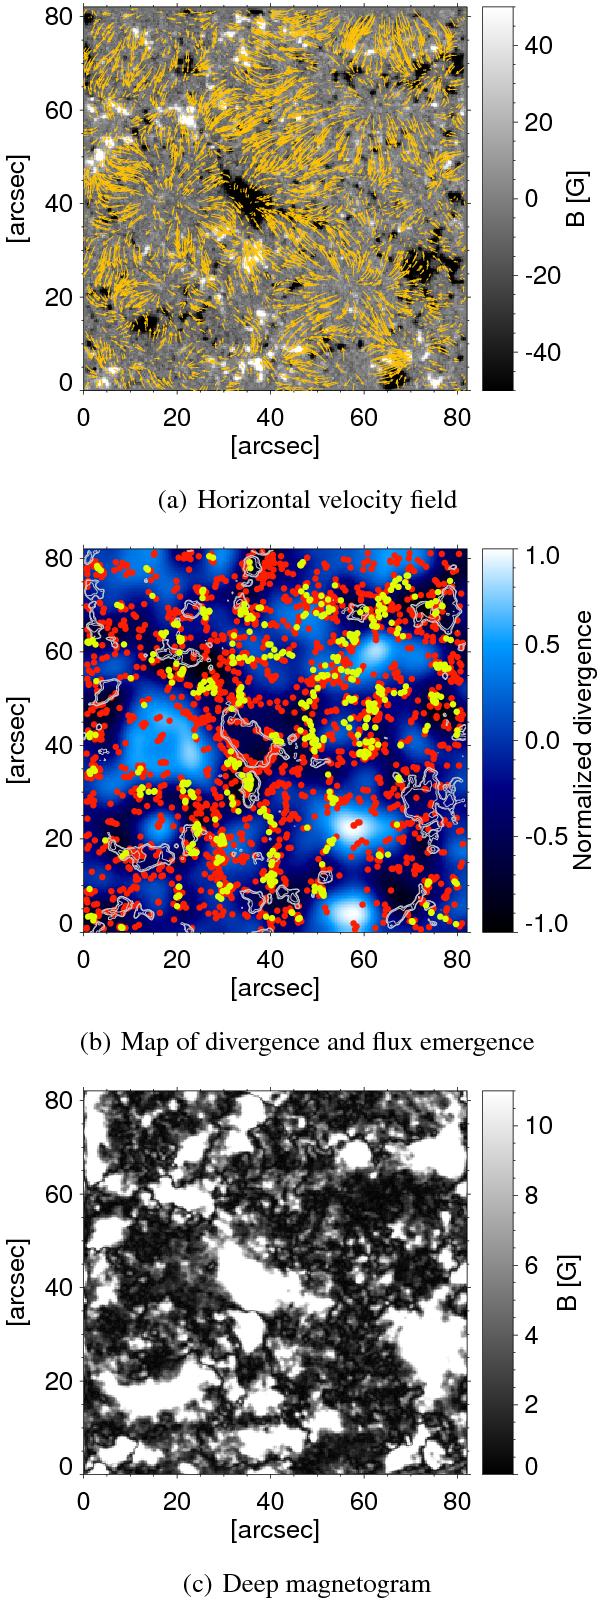
a) Time-averaged magnetogram obtained by averaging over the total duration of the data set with the horizontal velocity field obtained from the local correlation tracking superimposed (LCT, orange arrows). b) Normalized divergence map obtained from LCT with the location of magnetic appearance events over the whole duration of the data set (red dots), and flux emergence events (yellow dots). The white contours indicate the location of the maxima of the absolute value of the magnetic field (| B| > 50 G). c) Deep absolute magnetogram saturated at 11 G.
Current usage metrics show cumulative count of Article Views (full-text article views including HTML views, PDF and ePub downloads, according to the available data) and Abstracts Views on Vision4Press platform.
Data correspond to usage on the plateform after 2015. The current usage metrics is available 48-96 hours after online publication and is updated daily on week days.
Initial download of the metrics may take a while.