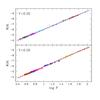
Fig. 10
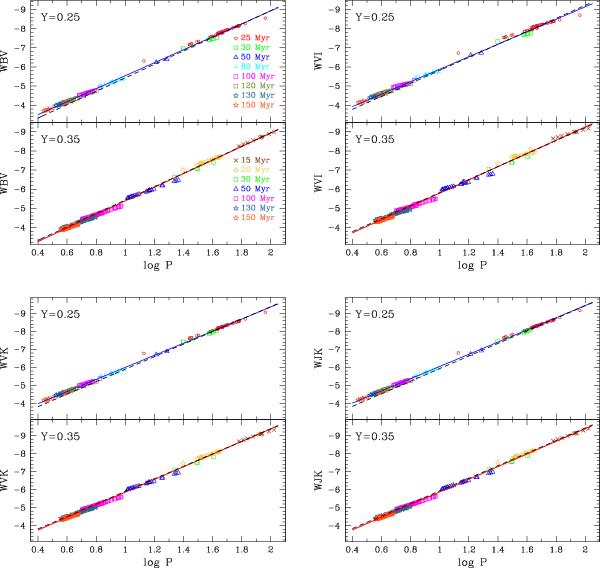
PW relations in different filter combinations [V,(B − V)] (upper left panel), [I,(V − I)] (upper right panel), [K,(V − K)] (lower left panel) and [K,(J − K)] (lower right panel) for the two single-He abundance populations, as labeled. Colors refer to populations with different ages as reported in the upper left panel. In each upper (lower) panel, the solid blue (red) line is the PW relation derived for Cepheids with Y = 0.25 (Y = 0.35), while the dashed black line indicates the PW relation derived by combining the stellar populations with different helium abundances.
Current usage metrics show cumulative count of Article Views (full-text article views including HTML views, PDF and ePub downloads, according to the available data) and Abstracts Views on Vision4Press platform.
Data correspond to usage on the plateform after 2015. The current usage metrics is available 48-96 hours after online publication and is updated daily on week days.
Initial download of the metrics may take a while.