Free Access
Fig. 6
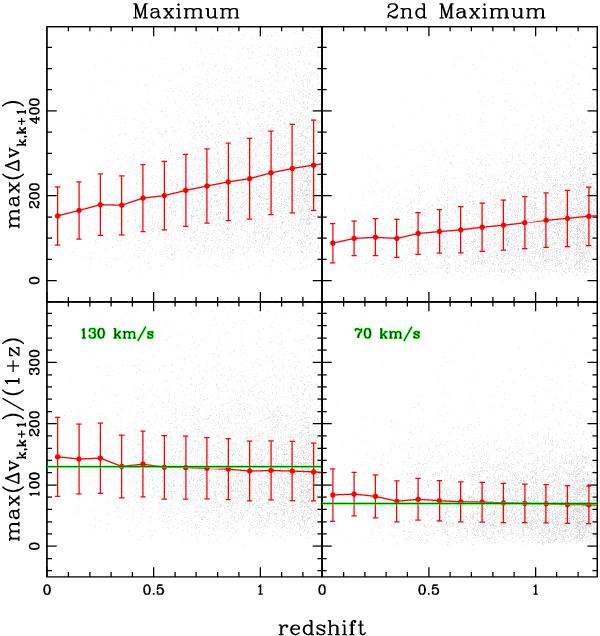
Left upper panel: scatter plot of the maximum velocity difference of the members in the line of sight to their closest neighbours. Right upper panel: the same as the right panel, but using the second maximum. In the lower panels we divided the upper panels by (1 + z).
Current usage metrics show cumulative count of Article Views (full-text article views including HTML views, PDF and ePub downloads, according to the available data) and Abstracts Views on Vision4Press platform.
Data correspond to usage on the plateform after 2015. The current usage metrics is available 48-96 hours after online publication and is updated daily on week days.
Initial download of the metrics may take a while.