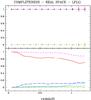
Fig. 5
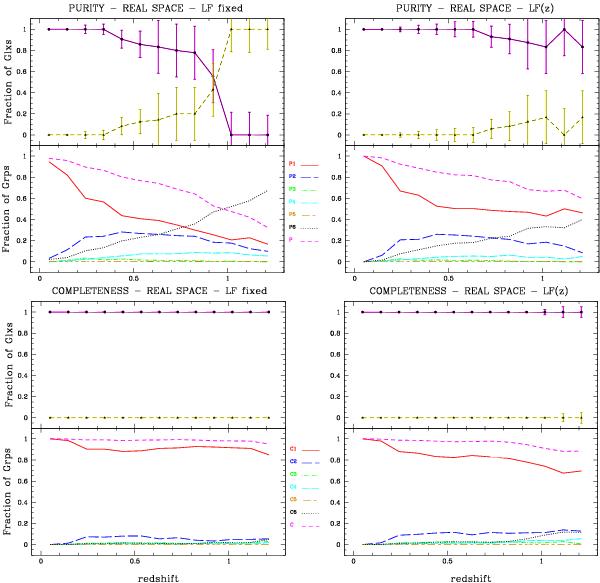
Purity and completeness as a function of redshift for groups identified in a flux-limited sample in real space. Left boxes show the purity (upper panels) and completeness (lower panels) when a fixed LF is used in the linking length parameters, while right boxes show the trends when a LF varying with redshift is used to compute the linking length parameters. In the upper boxes (purity), the top panels show the fraction of identified galaxies (Glxs) associated with the group with the highest matching rate in the corresponding control sample (solid lines), and the fraction of galaxies that are classified as interlopers (dashed lines). In the lower boxes (completeness), the top panels show the fraction of galaxies in the control sample that are associated with the group with the highest matching rate in the identified sample (solid lines), and the fraction of galaxies that are classified as missing galaxies (dashed lines). The bottom panels in each plot show the trends observed for the fraction of groups (Grps) within the six categories of purity or completeness (see text for description). The short-dashed magenta lines correspond to the complement of P6 and C6.

Current usage metrics show cumulative count of Article Views (full-text article views including HTML views, PDF and ePub downloads, according to the available data) and Abstracts Views on Vision4Press platform.
Data correspond to usage on the plateform after 2015. The current usage metrics is available 48-96 hours after online publication and is updated daily on week days.
Initial download of the metrics may take a while.