Fig. 4
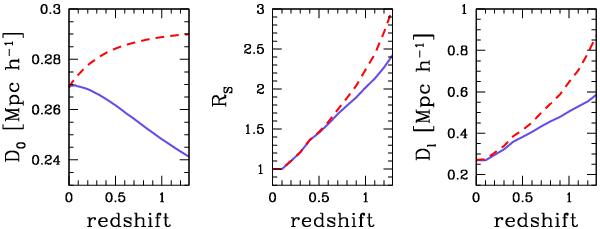
Variation of the linking length parameters as a function of redshift. The left panel shows the transversely linking length for volume-limited samples, D0, the middle panel shows the scale factor Rs, while the right panel shows the transverse linking length for flux-limited samples, Dl (see equations in Sect. 3.2). The solid blue lines show the parameters using a LF that varies with redshift (see Fig. 3) while dashed red lines show the parameters when a fixed LF at redshift close to zero is adopted.
Current usage metrics show cumulative count of Article Views (full-text article views including HTML views, PDF and ePub downloads, according to the available data) and Abstracts Views on Vision4Press platform.
Data correspond to usage on the plateform after 2015. The current usage metrics is available 48-96 hours after online publication and is updated daily on week days.
Initial download of the metrics may take a while.