Free Access
Fig. 2
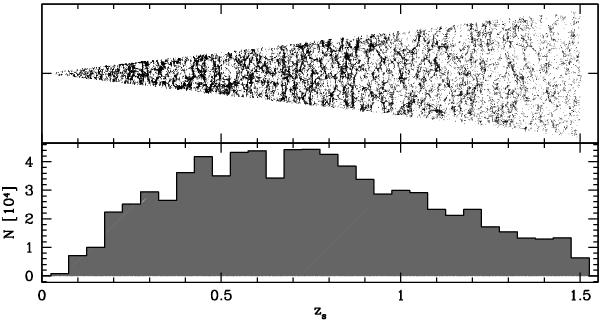
Upper panel: a pie plot projection showing, in a thin slice, the distribution of the mock galaxies as a function of redshift. Lower panel: redshift distribution of galaxies with iSDSS ≤ 23 in the selected light-cone with an angular coverage of 17.6 deg2. The maximum redshift of the sample is ~1.5.
Current usage metrics show cumulative count of Article Views (full-text article views including HTML views, PDF and ePub downloads, according to the available data) and Abstracts Views on Vision4Press platform.
Data correspond to usage on the plateform after 2015. The current usage metrics is available 48-96 hours after online publication and is updated daily on week days.
Initial download of the metrics may take a while.