Fig. 12
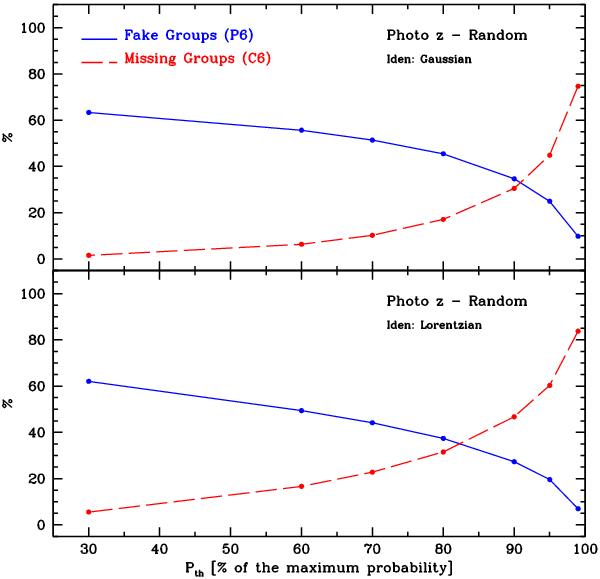
Percentages of false groups (solid blue line) and missing groups (dashed red line) as a function of the probability threshold used in the group identification algorithm. Top panel (bottom panel) corresponds to the identifications performed using a Gaussian (Lorentzian) function in the PFOF algorithm and in the assignment of random photometric redshifts.
Current usage metrics show cumulative count of Article Views (full-text article views including HTML views, PDF and ePub downloads, according to the available data) and Abstracts Views on Vision4Press platform.
Data correspond to usage on the plateform after 2015. The current usage metrics is available 48-96 hours after online publication and is updated daily on week days.
Initial download of the metrics may take a while.