Fig. 11
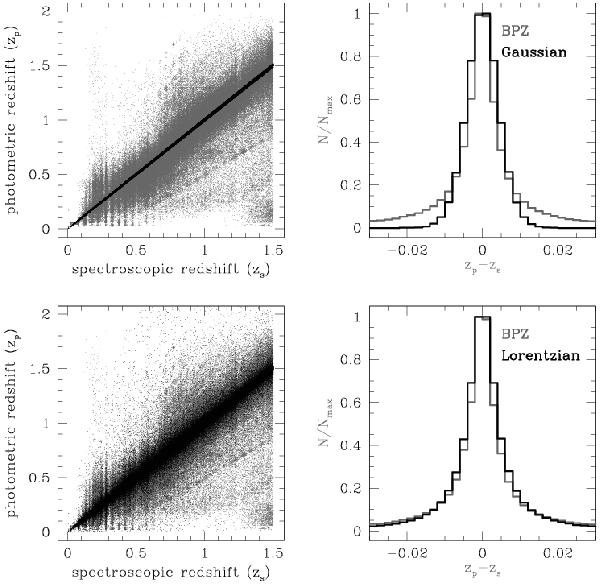
Left panels: scatter plots between the spectroscopic redshift (zs) and the photometric redshift (zp). Right panels: close-up of the distribution of the redshift differences zp − zs for | zp − zs | < 0.03. The grey colour is used when the photometric redshifts are computed using the BPZ code, while the black colour is used when the photometric redshifts are assigned randomly. In the upper panels the random photometric redshifts are assigned using a Gaussian probability distribution with the spectroscopic redshift as the centre and 0.0025 as the Gaussian width. In the lower panels the random photometric redshifts are assigned using a Lorentzian probability distribution, with a width of 0.00244 (see text for full description).
Current usage metrics show cumulative count of Article Views (full-text article views including HTML views, PDF and ePub downloads, according to the available data) and Abstracts Views on Vision4Press platform.
Data correspond to usage on the plateform after 2015. The current usage metrics is available 48-96 hours after online publication and is updated daily on week days.
Initial download of the metrics may take a while.