Fig. 8
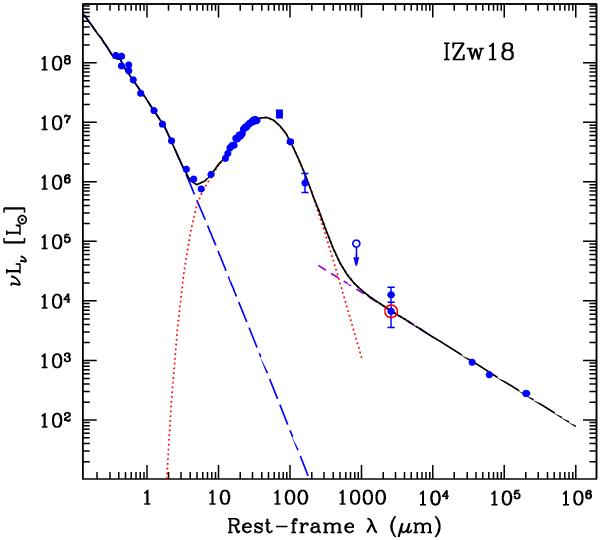
SED of I Zw 18, together with best-fit DUSTY model overlaid. The large open (red) circle shows the dust-only emission taken from Leroy et al. (2007), while the small filled (blue) circle above it shows the total 2.6 mm emission. The black curve represents the DUSTY fit, and the dotted (red) curve, only the dust; the long-dashed (blue) curve shows the stars. The error bars are masked by the size of the symbols. As in Fig. 3, DUSTY models only extend to 1 mm, so the excess above the dust-only emission is the extrapolation of the radio with a spectral index of −0.25 (see text). The pure radio component is shown by a short-dashed (purple) line (longward of 250 μm).
Current usage metrics show cumulative count of Article Views (full-text article views including HTML views, PDF and ePub downloads, according to the available data) and Abstracts Views on Vision4Press platform.
Data correspond to usage on the plateform after 2015. The current usage metrics is available 48-96 hours after online publication and is updated daily on week days.
Initial download of the metrics may take a while.