Fig. 5
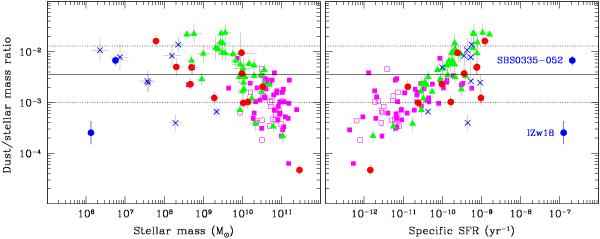
Ratios of dust mass to stellar mass plotted against stellar mass (Mstar, left panel) and specific SFR (yr-1, right). SBS 0335−052 and I Zw 18 are plotted as filled (blue) circles. Data for KINGFISH galaxies, taken from Kennicutt et al. (2011), are also shown: × (for late Hubble types T ≥ 8), filled (green) triangles (0 < T < 8), and filled (red) circles (for early Hubble types T ≤ 0). The horizontal lines give the mean dust/stellar mass ratio for the KINGFISH sample, and the 1σ standard deviation. Given as open (magenta) squares are the passive spirals studied by Rowlands et al. (2012) and as filled (magenta) squares their early-type galaxies.
Current usage metrics show cumulative count of Article Views (full-text article views including HTML views, PDF and ePub downloads, according to the available data) and Abstracts Views on Vision4Press platform.
Data correspond to usage on the plateform after 2015. The current usage metrics is available 48-96 hours after online publication and is updated daily on week days.
Initial download of the metrics may take a while.