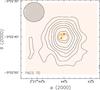
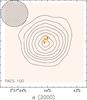
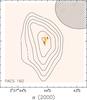
Fig. 2
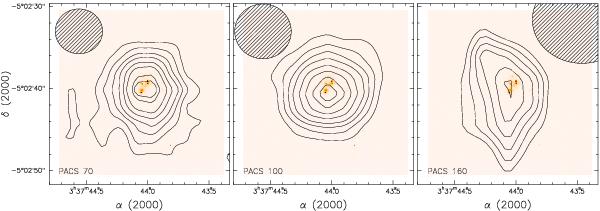
PACS images of SBS 0335−052 superimposed as contours on the F555M HST/ACS image shown with false colors (see also Fig. 1). From left to right are PACS 70, 100, and 160 μm maps. Contours start at 3σ and run to 22σ for PACS 70, to 20σ for PACS 100, and for PACS 160 to 8σ. These σ values correspond to the correlated noise measured from the images, which are roughly 4× smaller than the true noise (see PACS documentation and text). PACS beam sizes are shown as shaded ellipses in the upper portion of each panel. For display purposes, the PACS images have been rebinned to smaller pixel sizes.
Current usage metrics show cumulative count of Article Views (full-text article views including HTML views, PDF and ePub downloads, according to the available data) and Abstracts Views on Vision4Press platform.
Data correspond to usage on the plateform after 2015. The current usage metrics is available 48-96 hours after online publication and is updated daily on week days.
Initial download of the metrics may take a while.