Fig. 3
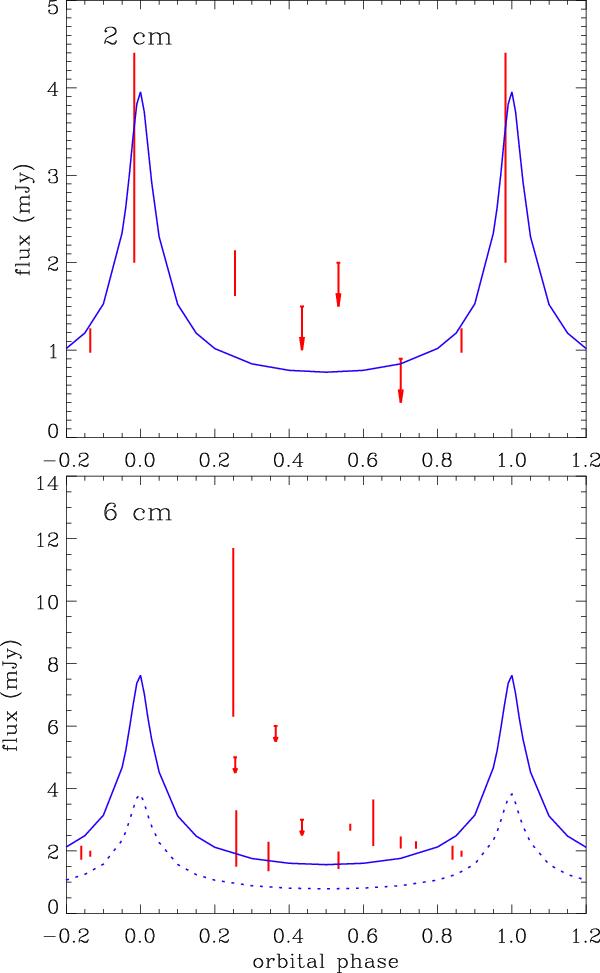
Comparison between 9 Sgr observed and model radio fluxes, as a function of orbital phase in the 9.1 year period. Top: 2 cm fluxes, bottom: 6 cm fluxes. The observed data are plotted in red, the theoretical fluxes of the best-fit model in blue. In the bottom panel, the dotted blue line shows the best-fit 2 cm model applied to the 6 cm data.
Current usage metrics show cumulative count of Article Views (full-text article views including HTML views, PDF and ePub downloads, according to the available data) and Abstracts Views on Vision4Press platform.
Data correspond to usage on the plateform after 2015. The current usage metrics is available 48-96 hours after online publication and is updated daily on week days.
Initial download of the metrics may take a while.