Fig. 6
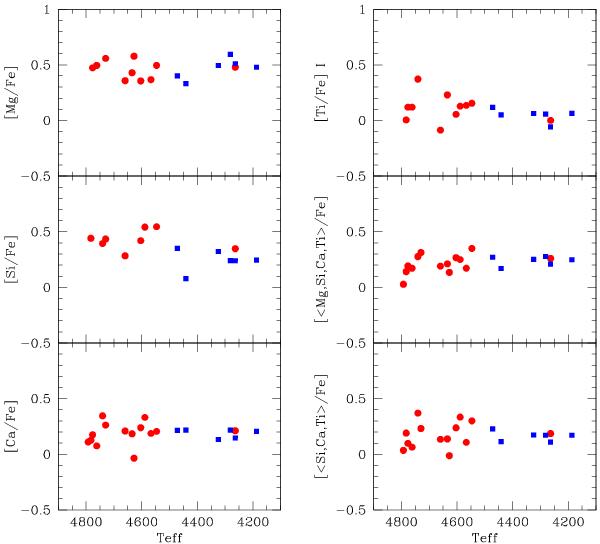
Abundance ratios of α-elements Mg, Si, Ca, and Ti i as functions of the effective temperature. The average of [α/Fe] ratios are shown in the last two panels on the right column (including and excluding the Mg abundance from the mean, respectively). Red circles are for stars observed with GIRAFFE, while blue squares indicate stars with UVES spectra. Internal star-to-star errors are listed in Table 5 and Table 4, respectively.
Current usage metrics show cumulative count of Article Views (full-text article views including HTML views, PDF and ePub downloads, according to the available data) and Abstracts Views on Vision4Press platform.
Data correspond to usage on the plateform after 2015. The current usage metrics is available 48-96 hours after online publication and is updated daily on week days.
Initial download of the metrics may take a while.