Fig. 9
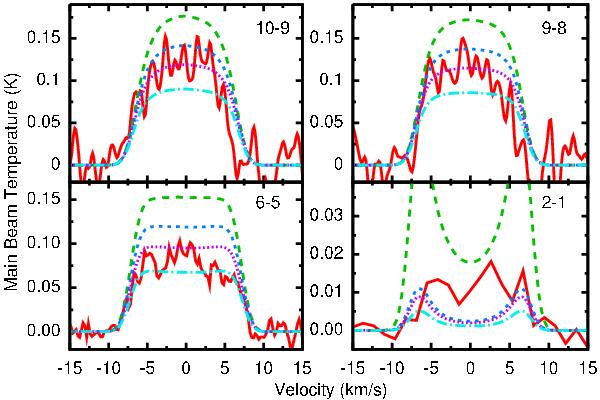
Model calculations for different 12CO/13CO ratios compared to the observed 13CO lines adopting the dissociation radius by Mamon et al. (1988). The solid red line represents the observations. The long-dashed green, short-dashed blue, dotted purple, and dot-dashed light blue lines are for intrinsic isotope ratios 10, 15, 20, and 30, respectively. Transitions J = 10–9 and 9–8 have been smoothed for a better visualization.
Current usage metrics show cumulative count of Article Views (full-text article views including HTML views, PDF and ePub downloads, according to the available data) and Abstracts Views on Vision4Press platform.
Data correspond to usage on the plateform after 2015. The current usage metrics is available 48-96 hours after online publication and is updated daily on week days.
Initial download of the metrics may take a while.