Fig. 4
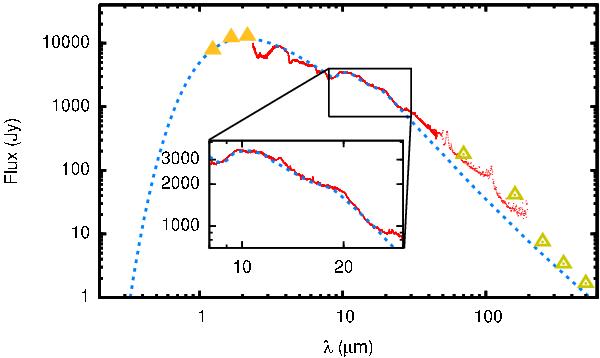
Dust model (dashed blue line) compared to the ISO (red) and PACS and SPIRE (open yellow triangles) photometric observations and to near-IR photometric observations (filled yellow triangles). The fit to the silicate and amorphous aluminium oxide spectral features is shown in detail. The feature at 13 μm is not taken into account in our fit.
Current usage metrics show cumulative count of Article Views (full-text article views including HTML views, PDF and ePub downloads, according to the available data) and Abstracts Views on Vision4Press platform.
Data correspond to usage on the plateform after 2015. The current usage metrics is available 48-96 hours after online publication and is updated daily on week days.
Initial download of the metrics may take a while.