Fig. 13
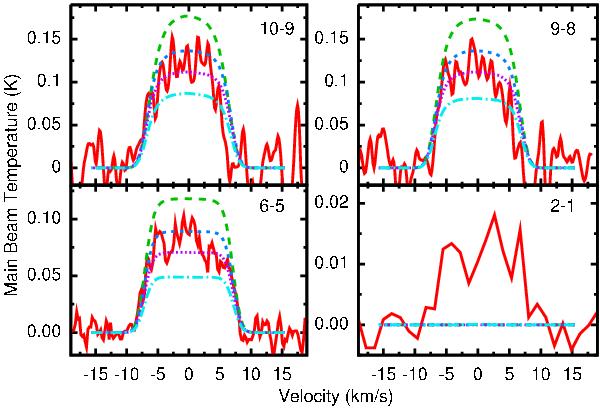
Models with r1/2 = 0.4, β = 5.0, and Ṁ= 1.3 × 10⁻⁷M⊙ yr-1 compared to the 13CO observed lines. The solid red line represents the observations. The long-dashed green, short-dashed blue, dotted pink, and dot-dashed light blue lines represent models with 12C/13C = 10, 15, 20, and 30, respectively. A value of 18 for the 12C/13C ratio reproduces the data best.
Current usage metrics show cumulative count of Article Views (full-text article views including HTML views, PDF and ePub downloads, according to the available data) and Abstracts Views on Vision4Press platform.
Data correspond to usage on the plateform after 2015. The current usage metrics is available 48-96 hours after online publication and is updated daily on week days.
Initial download of the metrics may take a while.