Fig. 14
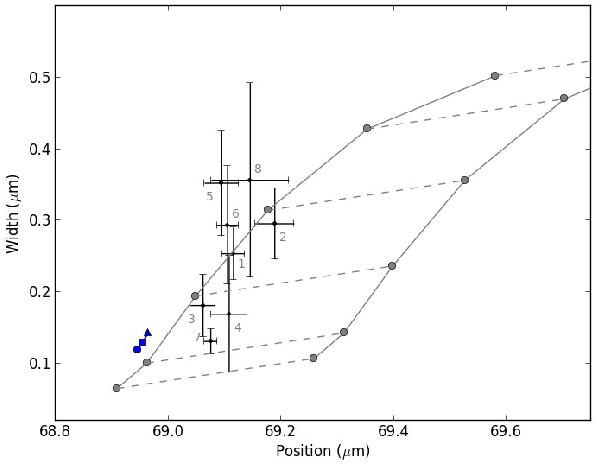
Width and position of the observed 69 μm bands relative to each other. The short blue curve connecting the circle, triangle and square in the lower left corner is for model 69 μm bands with a mass loss rate of 10 × 10-5 M⊙/yr. We also calculated model bands for the mass loss rates 1 × 10⁻⁵ M⊙/yr and 5 × 10⁻⁵ M⊙/yr, but these are not distinguishable from the 10 × 10-5 M⊙/yr models and they are not plotted. The circle, triangle and square are for superwind radii of 200, 500 and 2500 AU, respectively. In contrast to the standard model, in this case the crystalline olivine is also present in the pre-superwind mass loss period ejected before the superwind started. All other parameters are listed in Table 3. For the rest, the figure is the same as Fig. 10.
Current usage metrics show cumulative count of Article Views (full-text article views including HTML views, PDF and ePub downloads, according to the available data) and Abstracts Views on Vision4Press platform.
Data correspond to usage on the plateform after 2015. The current usage metrics is available 48-96 hours after online publication and is updated daily on week days.
Initial download of the metrics may take a while.