Fig. 11
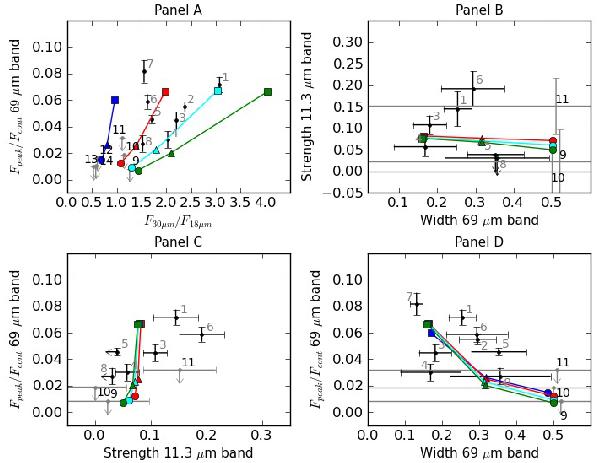
Properties of model and observed spectra. The circle, triangle and square markers indicate models with superwind radii of 200, 500 and 2500 AU respectively. The blue, red, teal and green curves are for models with mass loss rates of 1 × 10⁻⁵ M⊙/yr, 5 × 10⁻⁵ M⊙/yr, 10 × 10-5 M⊙/yr or 15 × 10-5 M⊙/yr respectively. All other model parameters are listed in Table 3. The observations are shown as in Fig. 8.
Current usage metrics show cumulative count of Article Views (full-text article views including HTML views, PDF and ePub downloads, according to the available data) and Abstracts Views on Vision4Press platform.
Data correspond to usage on the plateform after 2015. The current usage metrics is available 48-96 hours after online publication and is updated daily on week days.
Initial download of the metrics may take a while.