Fig. 10
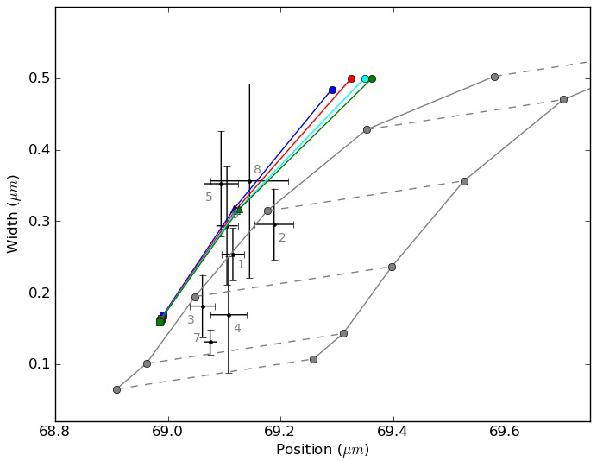
Width and position of the observed 69 μm bands relative to each other. Blue, red, teal and green curves correspond to mass loss rates of 1 × 10⁻⁵ M⊙/yr, 5 × 10⁻⁵ M⊙/yr, 10 × 10-5 M⊙/yr and 15 × 10-5 M⊙/yr, respectively. The circle, triangle and square are for superwind radii of 200, 500 and 2500 AU, respectively. All other model parameters are listed in Table 3. The width and position of the observed 69 μm bands are plotted with black dots. Gray solid and dashed lines are as in Fig. 7.
Current usage metrics show cumulative count of Article Views (full-text article views including HTML views, PDF and ePub downloads, according to the available data) and Abstracts Views on Vision4Press platform.
Data correspond to usage on the plateform after 2015. The current usage metrics is available 48-96 hours after online publication and is updated daily on week days.
Initial download of the metrics may take a while.