Fig. 8
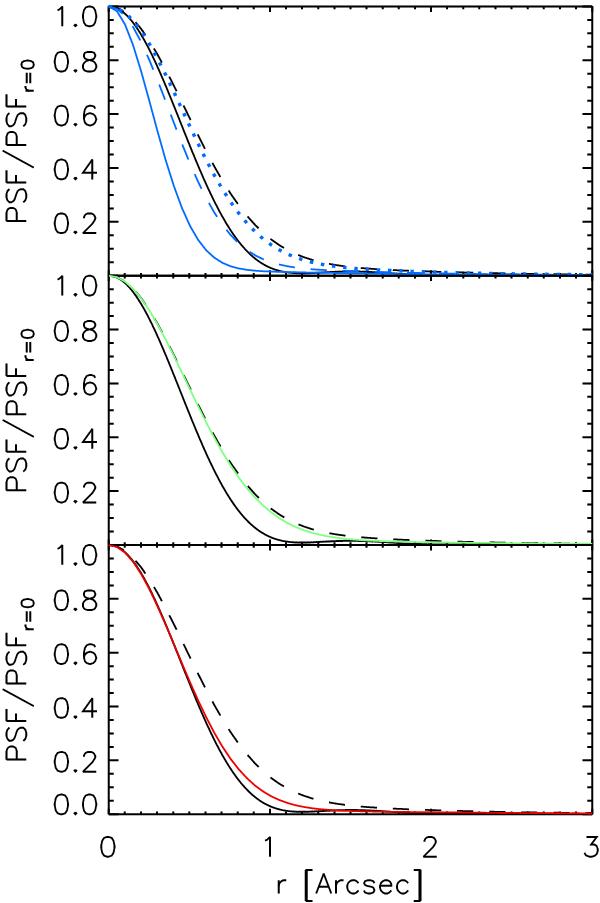
Comparison between K1 (black dashed curves), the ideal diffraction-limited PSF (black solid curves) and the other retrieved PSFs. The blue curves (top) represent the PSFs retrieved after blurring the edge of the disc of zeroes in the artificial image by kernels representing Gaussian functions with standard deviations of 0.2 (dotted), 0.3 (dashed) and 0.4 arcsec (solid). The green curve (middle) corresponds to the PSF found by subtracting the estimated aureole intensity from the mean transit image. The red curve (bottom) corresponds to K2. For illustration purposes, we set the value of Ai at zero (i.e., ignoring the azimuthal dependence) and normalized each PSF to the level at r = 0. As the retrieved PSFs represent estimates of the pixel integrated true PSF, the ideal diffraction-limited PSF was smoothed with a box function of pixel scale width to allow a direct comparison.
Current usage metrics show cumulative count of Article Views (full-text article views including HTML views, PDF and ePub downloads, according to the available data) and Abstracts Views on Vision4Press platform.
Data correspond to usage on the plateform after 2015. The current usage metrics is available 48-96 hours after online publication and is updated daily on week days.
Initial download of the metrics may take a while.