Fig. 6
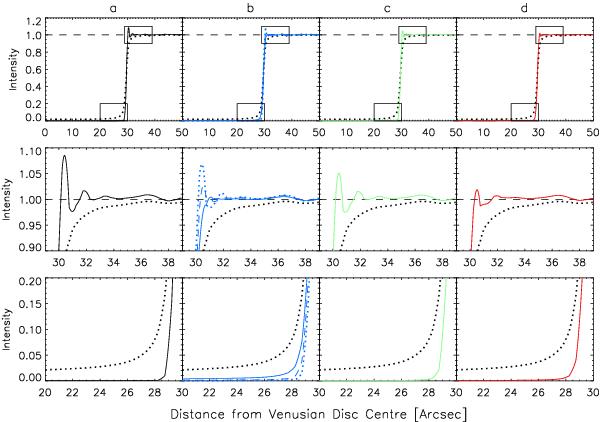
Top: radial intensity in the test transit image, corrected for limb darkening, as a function of distance from the centre of the Venusian disc before (black dotted curves) and after image restoration with the various PSF estimates. a) With K1 (black solid curve). b) With the PSFs obtained by blurring the edge of the disc of zeroes in the artificial image with kernels representing Gaussian functions with standard deviations of 0.2, 0.3 and 0.4 arcsec (blue dotted, dashed and solid curves). c) With the PSF retrieved by subtracting the estimated aureole intensity from the mean transit image (green solid curve). d) With K2 (red solid curve). Middle and bottom: blow-up insets of the boxed areas. The radius of the Venusian disc, a free parameter in the LMA optimization, is in all instances about 29.3 arcsec and not marked to avoid cluttering. The horizontal dashed lines follow unit intensity. The test transit image was corrected for limb darkening by normalizing it by the surface fit, computed as done for the mean transit image in Sect. 2.2.
Current usage metrics show cumulative count of Article Views (full-text article views including HTML views, PDF and ePub downloads, according to the available data) and Abstracts Views on Vision4Press platform.
Data correspond to usage on the plateform after 2015. The current usage metrics is available 48-96 hours after online publication and is updated daily on week days.
Initial download of the metrics may take a while.