Free Access
Fig. 4
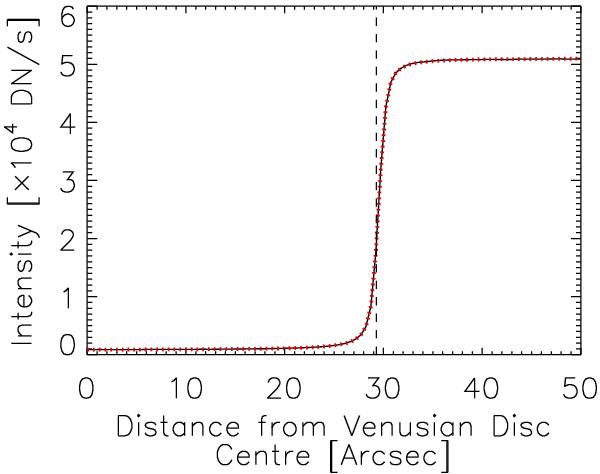
Radial intensity as a function of distance from the centre of the Venusian disc; from the mean transit image (black solid curve) and the convolution of the artificial image with K1 (red dotted curve). The dashed line marks the position of the Venus limb as returned along with K1 by the LMA optimization.
Current usage metrics show cumulative count of Article Views (full-text article views including HTML views, PDF and ePub downloads, according to the available data) and Abstracts Views on Vision4Press platform.
Data correspond to usage on the plateform after 2015. The current usage metrics is available 48-96 hours after online publication and is updated daily on week days.
Initial download of the metrics may take a while.