Fig. 3
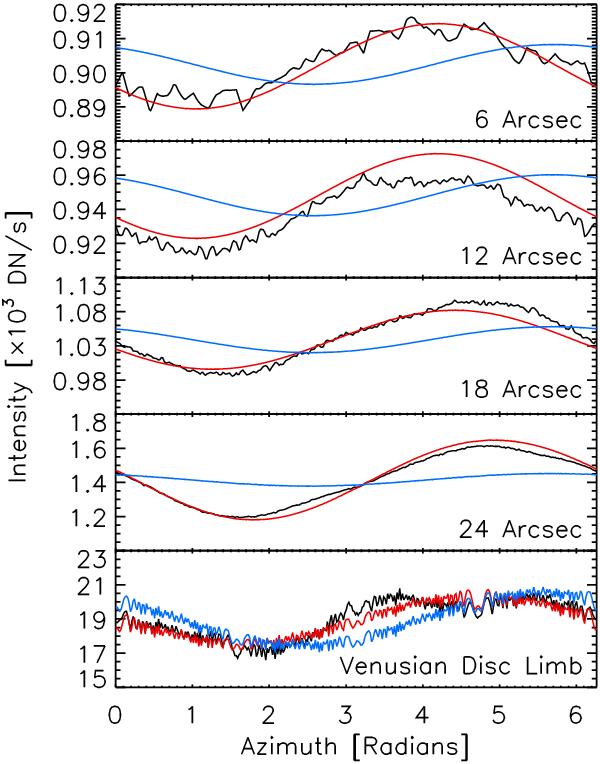
Intensity on the Venusian disc at distances of 6, 12, 18, and 24 arcsec from the centre, and along its limb (taking the radius of the Venusian disc retrieved along with K1 by the LMA optimization, 29.29 arcsec), as a function of azimuth. The black curves follow the values from the mean transit image and the red curves the values reproduced in the artificial image by the convolution with K1. The blue curves represent the intensity obtained in the artificial image by fixing Ai at zero. The intensity fluctuations along the Venusian limb arises from aliasing artefacts.
Current usage metrics show cumulative count of Article Views (full-text article views including HTML views, PDF and ePub downloads, according to the available data) and Abstracts Views on Vision4Press platform.
Data correspond to usage on the plateform after 2015. The current usage metrics is available 48-96 hours after online publication and is updated daily on week days.
Initial download of the metrics may take a while.