Fig. 23
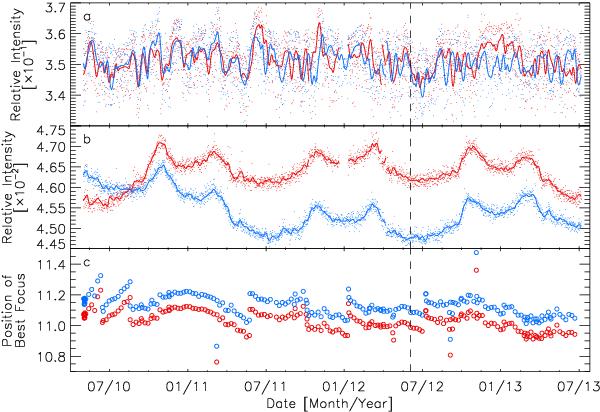
Radial intensity of the solar aureole, at distances of a) 1 and b) 10 arcsec from the edge of the solar disc, in the orbital noon and midnight continuum filtergrams from the side (red) and front (blue) CCDs. The value from each filtergram is normalized to the level at the edge of the solar disc. The dots represent the measured values and the curves the smoothed time series. Segments of measured values spaced more than one day apart were treated as separate time series, giving the gaps in the curves. c) The position of best focus, in units of focus steps (see text), from the (approximately) weekly focus calibration of the side (red circles) and front CCDs (blue circles). The dashed line marks the time of the transit of Venus.
Current usage metrics show cumulative count of Article Views (full-text article views including HTML views, PDF and ePub downloads, according to the available data) and Abstracts Views on Vision4Press platform.
Data correspond to usage on the plateform after 2015. The current usage metrics is available 48-96 hours after online publication and is updated daily on week days.
Initial download of the metrics may take a while.