Free Access
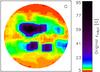
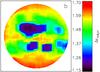
Fig. 22
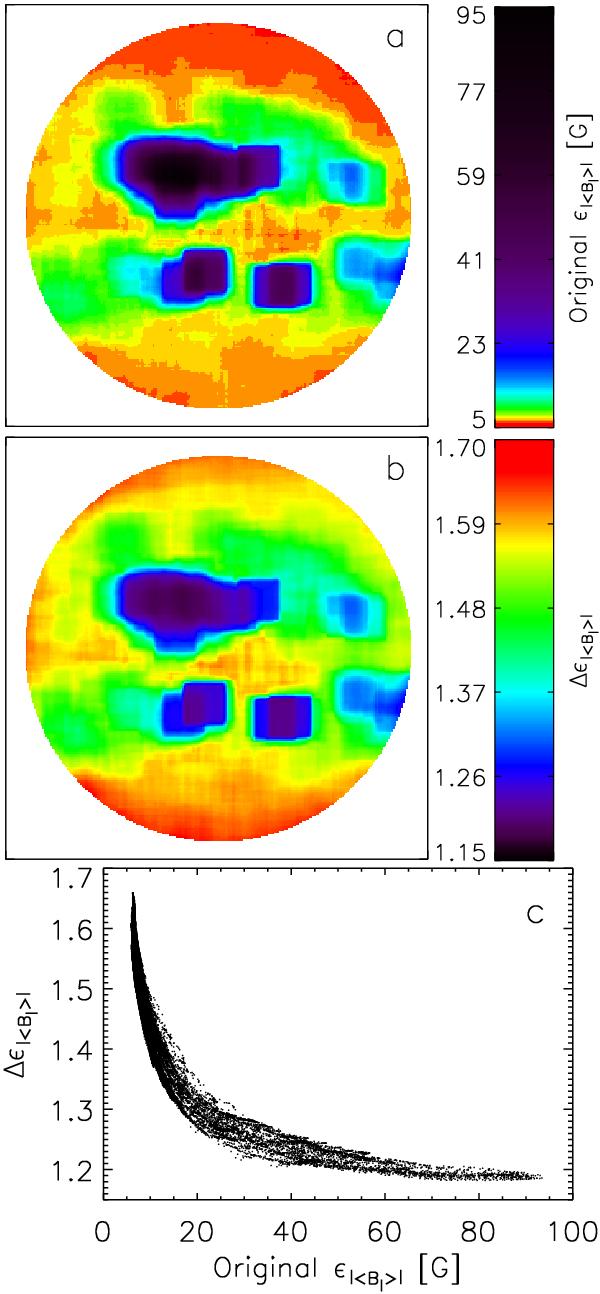
a) Mean unsigned magnetogram signal, ϵ|⟨Bl⟩| of the original (not corrected for stray light) 720 s longitudinal magnetogram. b) Factor enhancement of ϵ|⟨Bl⟩| from image restoration with K2, Δϵ|⟨Bl⟩|. c) Scatter plot of Δϵ|⟨Bl⟩| against the original ϵ|⟨Bl⟩|.
This figure is made of several images, please see below:
Current usage metrics show cumulative count of Article Views (full-text article views including HTML views, PDF and ePub downloads, according to the available data) and Abstracts Views on Vision4Press platform.
Data correspond to usage on the plateform after 2015. The current usage metrics is available 48-96 hours after online publication and is updated daily on week days.
Initial download of the metrics may take a while.