Fig. 20
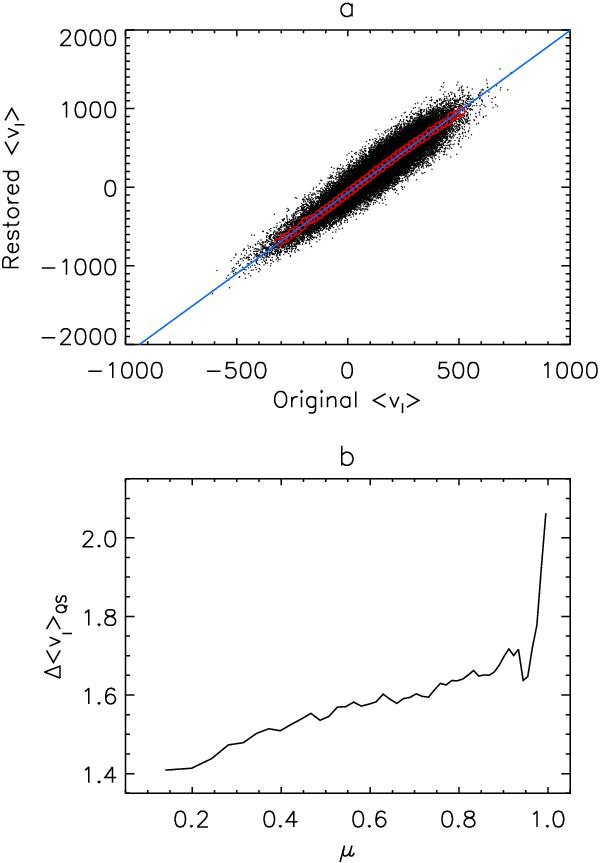
a) Scatter plot of the Dopplergram signal, ⟨vl⟩ in the quiet Sun, near disc centre (μ > 0.99), in the restored (with K2) and uncorrected versions of the 720 s Dopplergram. The red circles denote the bin-median (from binning the points by the uncorrected ⟨vl⟩ in intervals of 20ms-1) and the blue line the corresponding linear regression fit. b) The factor enhancement of ⟨vl⟩ in the quiet Sun from image restoration, Δ⟨vl⟩QS as a function of μ.
Current usage metrics show cumulative count of Article Views (full-text article views including HTML views, PDF and ePub downloads, according to the available data) and Abstracts Views on Vision4Press platform.
Data correspond to usage on the plateform after 2015. The current usage metrics is available 48-96 hours after online publication and is updated daily on week days.
Initial download of the metrics may take a while.